 ROS Index

|
ros2_pulse package from ros2_pulse reporos2_pulse |
ROS Distro
|
Package Summary
| Version | 0.5.0 |
| License | Apache-2.0 |
| Build type | AMENT_CMAKE |
| Use | RECOMMENDED |
Repository Summary
| Checkout URI | https://github.com/TanayK07/ros2_pulse.git |
| VCS Type | git |
| VCS Version | main |
| Last Updated | 2026-10-02 |
| Dev Status | DEVELOPED |
| Released | RELEASED |
| Contributing |
Help Wanted (-)
Good First Issues (-) Pull Requests to Review (-) |
Package Description
Additional Links
Maintainers
- Tanay Kedia
Authors
ros2_pulse
The heartbeat of your ROS 2 graph. A low-overhead probe that measures per-topic message rate and active-node liveness for both inter-process and intra-process traffic, on stock ROS 2 binaries, with no rebuild, no privileges and no network traffic. The counting hot path costs under a nanosecond per message; the whole probe costs about 2 % of workload CPU on a harsh 4,900 msg/s stress and less on real graphs.




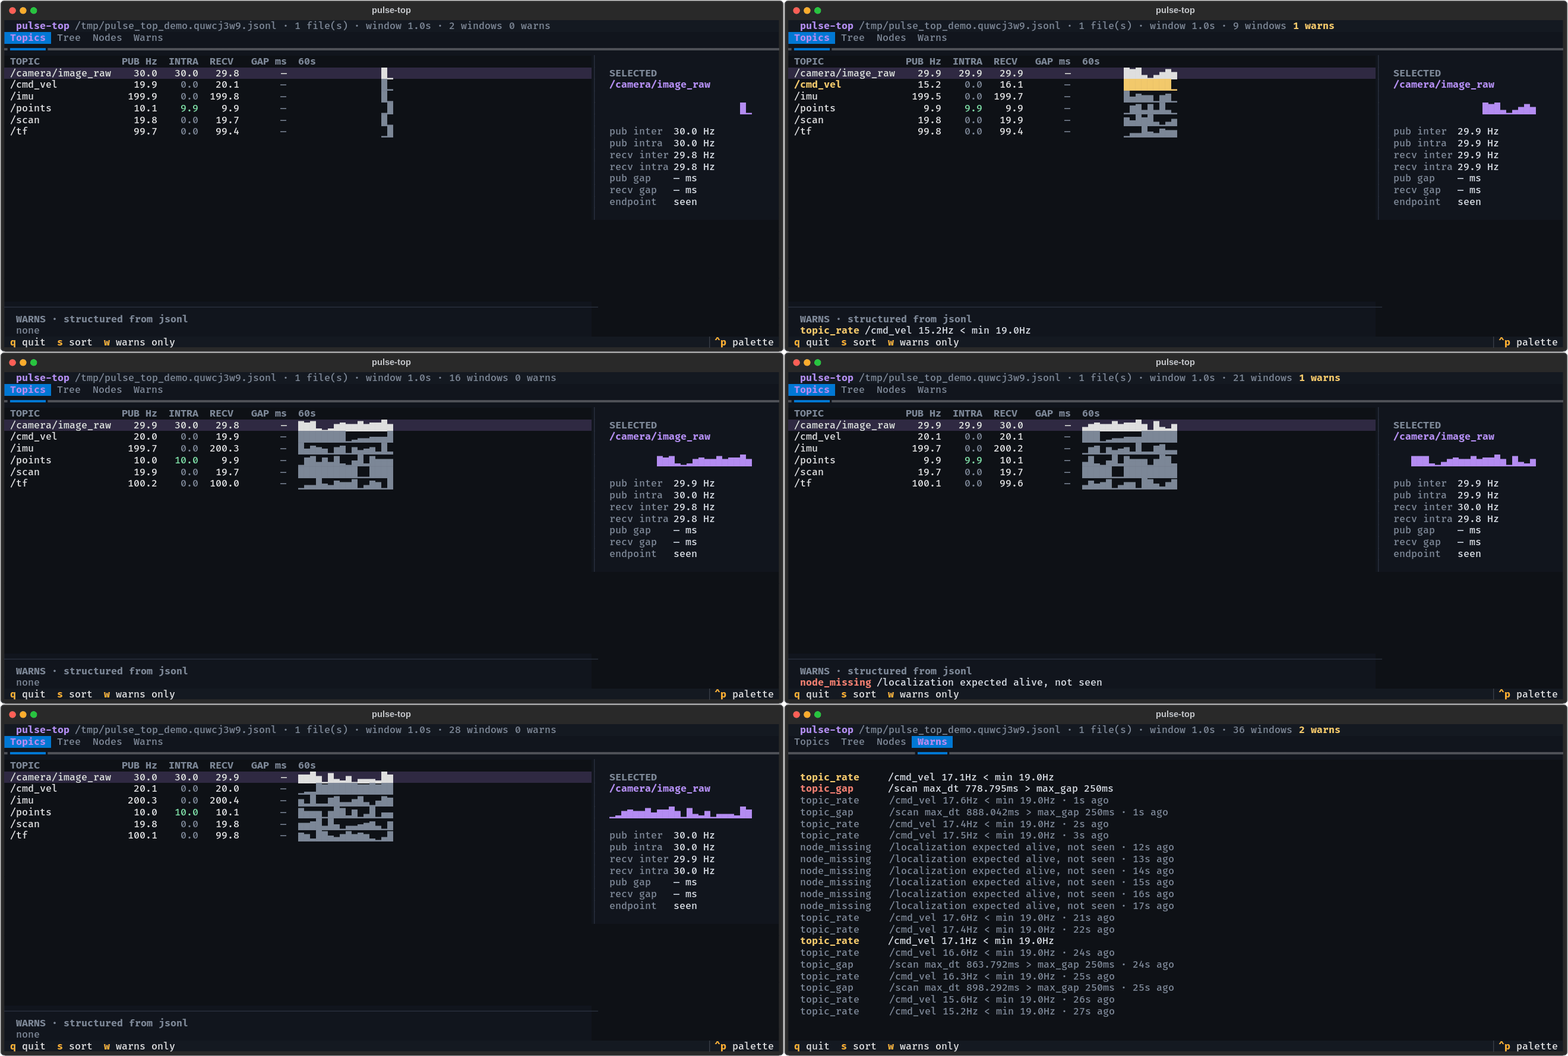
pulse-top --demo: the probe’s log, live. Sparklines per topic, intra-process rates, structured warnings with ages. Install: pip3 install ros2-pulse-top (details).
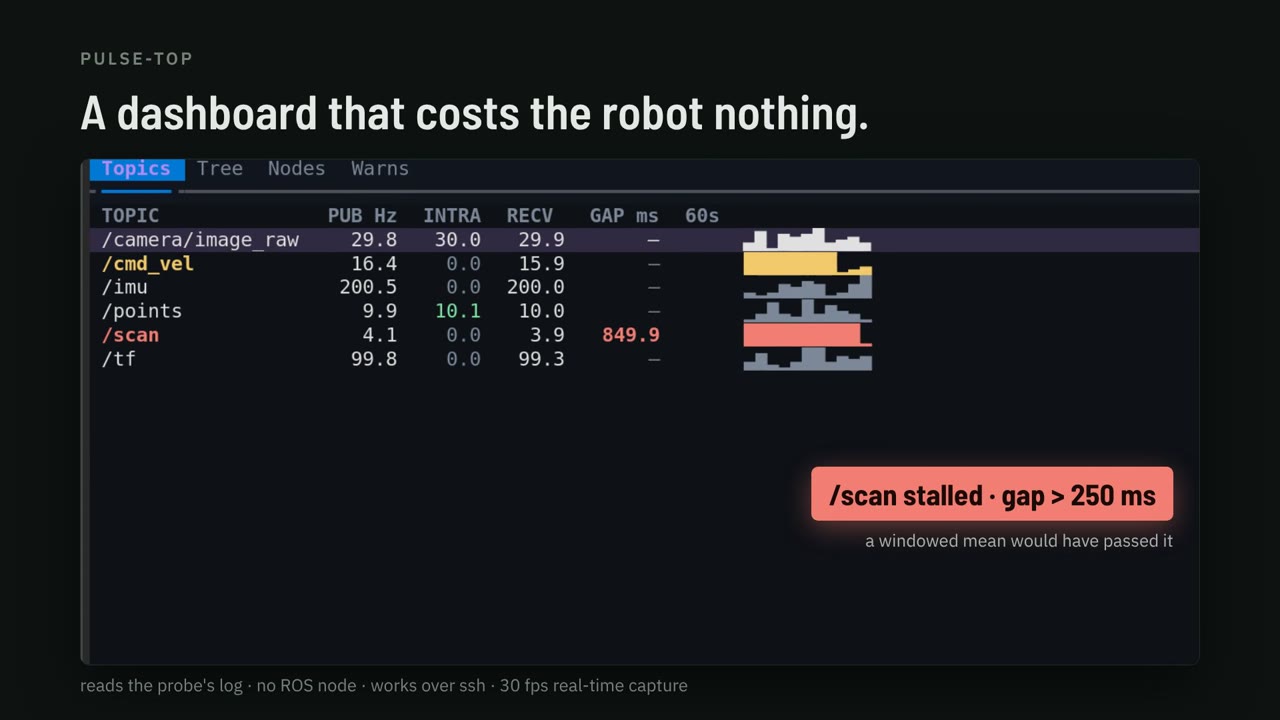
Forty seconds on what watching a topic costs and what the probe does instead. Watch the video (40 s, YouTube) or read the docs.
The long version, for systems programmers: Watching a ROS 2 topic changes it, the observer-effect measurement and the symbol-interposition trick that avoids it.
Why
The question in production is simple: is every topic flowing at the rate it should, and which nodes are alive? The existing tools each fall short of answering it.
-
ros2 topic hzandros2 topic echosubscribe to one topic at a time. Watching a single 100 KB topic costs 7 % of a core withhzand 31 % withecho, they cannot see intra-process messages at all, and pointinghzat an intra-process topic makes the publisher start serializing every message, which raised the watched process’s CPU by 52 % in our measurements. - Built-in topic statistics are
bypassed by intra-process comms on Humble-class
binaries, so composable nodes carrying point clouds lose all introspection. This is fixed on
rollingand newer by rclcpp#3130 (merged April 2026); there is no public Humble backport as of this writing. -
ros2_tracing/ LTTng is built for offline analysis: a session daemon plus post-processing of a CTF trace just to get a rate. On Humble it also needs ROS rebuilt with the lttng-ust backend (Jazzy and newer trace out of the box). - CARET (Tier IV) uses the same hook layer as this probe, LD_PRELOAD over tracetools, which is a useful independent validation of the mechanism. It is built for deep offline latency and chain analysis and needs LTTng, a forked rclcpp and Jupyter post-processing. Complementary, not always-on.
- eBPF uprobes need
CAP_SYS_ADMIN, debugfs and a kernel with BTF and uprobes, which is often a non-starter on Jetson and other embedded targets, and they pay a kernel trap per message.
ros2_pulse hooks the tracetools instrumentation layer that rclcpp already calls on every
publish and every callback, counts in-process with a lock-free hot path, and writes ready-to-read
Hz to a small rolling file.
What you get
# ts_ns=1782887153899445923 window_s=5.000
TOPIC /scan 20.000000                      # publish-side, inter-process
PUB   /points inter=0.000000 intra=30.000000   # publish-side incl. intra (Iron+)
RECV  /scan inter=20.000000 intra=0.000000 # receive-side, BOTH transports
RECV  /points inter=0.000000 intra=30.000000   # <- intra-process, invisible to other tools on Humble
JITTER /scan recv max_dt_ms=21.284             # largest inter-arrival gap (opt-in, see below)
NODE  /perception
NODE  /planner
WARN  TOPIC /scan hz=1.200000 expected=[18,22]  # only with an expected-rate spec (see below)
If a sidecar exporter or a log shipper is reading instead of a person, ROS_TOPIC_STATS_FORMAT=jsonl
writes every window as one JSON object per line with the same gates and values. See
JSON Lines output. Dashboards that already
read rclcpp’s built-in topic statistics get the same numbers on /statistics from the
pulse_bridge sidecar, and Prometheus, OTLP and
Grafana get them from pulse-export.
How it works
libros2_pulse.so is injected with LD_PRELOAD. It exports the same symbols as
libtracetools.so’s tracepoint API (ros_trace_rcl_publish, ros_trace_callback_start, the
init tracepoints and so on). The dynamic linker binds rclcpp’s calls to ours first; each
interposer records a stat and forwards to the real function through dlsym(RTLD_NEXT, ...).
rclcpp calls these functions unconditionally (the LTTng enable check is inside them), so the
probe works with no tracing session and adds no DDS traffic.
- Intra-process visibility comes from
callback_start(callback, is_intra_process), which fires for every subscription callback regardless of transport. - The hot path is a per-endpoint relaxed atomic increment behind a 256-slot thread-local cache with a stride-breaking hash. No global lock, no per-message string hashing. Counting costs about 0.3 ns/op on a fixed endpoint and 0.6 to 1.2 ns/op alternating across a working set on the reference box, two orders of magnitude under a single LTTng-UST tracepoint (about 158 ns).
- A background timer snapshots and resets the counts every
ROS_TOPIC_STATISTICS_PUBLISH_PERIODseconds and appends the rates toROS_TOPIC_STATS_OUTPUT_FILE.
The pure C++ core (core/) has no ROS dependency and is unit tested on its own; the probe layer
(probe/) is a thin LD_PRELOAD shim.
Install
apt
File truncated at 100 lines see the full file
Changelog
All notable changes to this project are documented here. Format follows Keep a Changelog; versions follow SemVer.
[Unreleased]
Fixed
-
pulse-top 0.4.1: pulse-top found no files on a default-format stack (issue #58). With the
probe in
.bashrcand noROS_TOPIC_STATS_FORMAT, every log is in the default text format. pulse-top parsed jsonl only, and it redrew the top bar only after a parsed window, so a directory of healthy text logs read “0 file(s)” forever even though the glob had matched them all. pulse-top and pulse-export now read the text format as well, sniffed per line like the C++log_reader, and a text window maps to the sameWindowits jsonl twin parses to (a line the probe did not print stays an absent field, never 0). The top bar is redrawn every tick, puts the file count before the path, and a notice line says why the table is empty: no file matches yet, N files found and waiting for the first window, or which files are not probe output. The follower now keeps blank lines, which close a text window, so no window arrives one period late. pulse-export’slines_skipped_totalcounts only lines that are in neither format. -
pulse-top 0.4.1:
--theme light|dark|terminalandPULSE_TOP_THEME(issue #59). The colours were hard-coded for a dark background, unreadable on the white terminals used outdoors.lightis black on white with warn colours picked to read on white (amber is brown, not yellow);terminalpaints nothing and uses the terminal’s own background and ANSI palette (Textual’sansi-darktheme);darkstays the default. The stylesheet now takes every colour from the Textual theme. The active tab’s label was invisible while the tab bar had focus (purple on purple) and is readable again. Textual floor raised to 8.2.7 for the ANSI theme. -
A publisher frozen by SIGSTOP read as a ~0 ms gap after it resumed. The flush timer
advanced its deadline one interval per fire, so when the whole probed process was frozen (the
flush thread with it) it replayed every missed tick back to back on SIGCONT: one window
carrying the stall, then a burst of ~0-length windows with a near-0
pub_max_dt_ms/recv_max_dt_msand nonsense Hz (50,000 Hz in one run). pulse-top and pulse-export keep the latest window, so a 5 s camera freeze showed as a 0.03 ms gap and thetopic_gapwarn was buried. The timer now re-phases instead of replaying: after a stall there is exactly one long window holding the full gap (5021 ms on the same repro), then normal cadence, and no window is ever shorter than half a period. Same fix on the receive side (a frozen subscriber process). The gap accounting itself was already right and is unchanged; the hot path is untouched. Regression testTimer.NoCatchUpBurstAfterStall.
Changed
- docs/ALTERNATIVES.md compares against NVIDIA’s
greenwave_monitor, the packaged subscriber-based monitor a Discourse reader said they were switching from; section plus a positioning-table row.
Added
-
pulse-top 0.4.0:
pulse-export, Prometheus / OTLP exporter and a Grafana example. A second entry point inros2-pulse-topthat tails the probe’s jsonl logs with pulse-top’s follower and parser and serves/metricsin the Prometheus text format on port 9464 from a stdlib HTTP server: per-topic publish and callback rate per path, largest gap,recv_lagdeficit, active warns, node up and last-seen age, per-process window period, age and timestamp, and window / warn / skipped-line counters, labelledpid(fromtopic_freq.<pid>.log),topic,node.--otlp URLpushes the same series as OTLP/HTTP JSON throughurllib(gauges, cumulative sums, UCUM units; checked against OpenTelemetry Collector 0.128.0). Absent keys stay absent series, never 0; a process that stops flushing loses its topic series after two periods and keeps a growing age. No new dependency.examples/grafana/holds a docker compose (exporter, Prometheus, Grafana) and a provisioned dashboard,--demoincluded; docs pagedocs/EXPORT.md.default_log_pathmoved fromapp.pytoreader.pyso the exporter does not import the TUI. 19 new pulse-top tests. -
pulse-top 0.3.0:
recv_lagwarn (issue #50). When a publisher’s process and a subscriber’s process are both probed, pulse-top pairs the topic’s publish rate (busier path) with its callback rate (inter + intra) and warns once the callbacks sit more than--lag-tol(default 10%) and more than two messages per window under the publish rate for--lag-windows(default 3) consecutive windows; it clears under half the tolerance and holds in between. A publish observation older than 1.5 periods cannot pair, so a dead or idle publisher (recv reads an explicit 0.0, KNOWN_ISSUES #12) is not lag; trackers are keyed by topic and source log, so a healthy subscriber process does not mask a lagging one, and a warn whose subscriber stopped flushing clears by time. Amber in the table (RECV cell), strip and Warns tab, with deficit, windows and source file in the sidebar; the text says the probe counts callbacks, not wire samples, so it cannot tell a drop from a backlog. Derived by the consumer: the probe, its output format, the spec grammar andpulse-checkare unchanged. Test node modeslow_listener <ms>andtest/integration/test_recv_lag.pyprove the two logs carry the gap and the model derives the warn from them; 21 new pulse-top tests. -
Blog post, “Watching a ROS 2 topic changes it”
(
docs/blog/2026-09-18-watching-a-ros2-topic-changes-it.md, on the docs site under Blog). The observer-effect bench written up for a systems-programming audience: what a subscriber costs (hz7 %,echo31 % of a core per watched 100 KB topic), whyhzon an intra-process topic switches serialization on in the watched process (+52 % CPU, 10/10 trials), howLD_PRELOADinterposition of theros_trace_*symbols counts in-process instead, and what that costs (+1.9 % ± 0.7 % paired). Every number cites its file and line in a trailing comment. Two figures underdocs/assets/blog/, regenerated from the committed CSV bybench/plot_observer_effect.py.site/build.pynow rewrites links relative to the page’s own directory (pages underblog/), and folds../in link targets, so a results page linking../../bench/RESULTS.mdlands on the benchmarks page instead of GitHub.
[0.5.0] - 2026-09-09
Adds an optional /statistics sidecar. The probe itself is unchanged.
Added
-
pulse_bridge(ros2 run ros2_pulse pulse_bridge): tails the probe’s jsonl log(s) and republishes every window on/statisticsasstatistics_msgs/MetricsMessage, in the shape rclcpp’s built-in topic statistics use (unitms,AVERAGE= message period,SAMPLE_COUNT,MAXIMUM= largest gap when measured), so existing consumers of that topic read pulse windows, intra-process included, with no integration work. Parameters:files,glob(default$TMPDIR/topic_freq.*.log, re-expanded every poll),topic,unit(ms|Hz),poll_period_s,source_name. Runs as its own process so the probe stays out of the DDS graph and free of rclcpp;package.xmlnow declaresrclcppandstatistics_msgsfor this executable only. Rate is measured at the subscription when the process has one, at the publisher otherwise; inter/intra report the busier path, never the sum. Text-format logs are refused with one warning per file. Asked for on ROS Discourse (topic 57637). -
core
metrics_mapperandline_follower: the window-to-sample mapping and the incremental line reader behind the bridge, ROS-free so both run in the standalone gtest lane
File truncated at 100 lines see the full file
Package Dependencies
| Deps | Name |
|---|---|
| ament_cmake | |
| ament_cmake_gtest | |
| ament_cmake_pytest | |
| rclpy | |
| std_msgs | |
| ros2run | |
| rclcpp | |
| statistics_msgs |
System Dependencies
| Name |
|---|
| lttng-tools |
Dependant Packages
Launch files
Messages
Services
Plugins
Recent questions tagged ros2_pulse at Robotics Stack Exchange
|
|
ros2_pulse package from ros2_pulse reporos2_pulse |
ROS Distro
|
Package Summary
| Version | 0.5.0 |
| License | Apache-2.0 |
| Build type | AMENT_CMAKE |
| Use | RECOMMENDED |
Repository Summary
| Checkout URI | https://github.com/TanayK07/ros2_pulse.git |
| VCS Type | git |
| VCS Version | main |
| Last Updated | 2026-10-02 |
| Dev Status | DEVELOPED |
| Released | RELEASED |
| Contributing |
Help Wanted (-)
Good First Issues (-) Pull Requests to Review (-) |
Package Description
Additional Links
Maintainers
- Tanay Kedia
Authors
ros2_pulse
The heartbeat of your ROS 2 graph. A low-overhead probe that measures per-topic message rate and active-node liveness for both inter-process and intra-process traffic, on stock ROS 2 binaries, with no rebuild, no privileges and no network traffic. The counting hot path costs under a nanosecond per message; the whole probe costs about 2 % of workload CPU on a harsh 4,900 msg/s stress and less on real graphs.
pulse-top --demo: the probe’s log, live. Sparklines per topic, intra-process rates, structured warnings with ages. Install: pip3 install ros2-pulse-top (details).
Forty seconds on what watching a topic costs and what the probe does instead. Watch the video (40 s, YouTube) or read the docs.
The long version, for systems programmers: Watching a ROS 2 topic changes it, the observer-effect measurement and the symbol-interposition trick that avoids it.
Why
The question in production is simple: is every topic flowing at the rate it should, and which nodes are alive? The existing tools each fall short of answering it.
-
ros2 topic hzandros2 topic echosubscribe to one topic at a time. Watching a single 100 KB topic costs 7 % of a core withhzand 31 % withecho, they cannot see intra-process messages at all, and pointinghzat an intra-process topic makes the publisher start serializing every message, which raised the watched process’s CPU by 52 % in our measurements. - Built-in topic statistics are
bypassed by intra-process comms on Humble-class
binaries, so composable nodes carrying point clouds lose all introspection. This is fixed on
rollingand newer by rclcpp#3130 (merged April 2026); there is no public Humble backport as of this writing. -
ros2_tracing/ LTTng is built for offline analysis: a session daemon plus post-processing of a CTF trace just to get a rate. On Humble it also needs ROS rebuilt with the lttng-ust backend (Jazzy and newer trace out of the box). - CARET (Tier IV) uses the same hook layer as this probe, LD_PRELOAD over tracetools, which is a useful independent validation of the mechanism. It is built for deep offline latency and chain analysis and needs LTTng, a forked rclcpp and Jupyter post-processing. Complementary, not always-on.
- eBPF uprobes need
CAP_SYS_ADMIN, debugfs and a kernel with BTF and uprobes, which is often a non-starter on Jetson and other embedded targets, and they pay a kernel trap per message.
ros2_pulse hooks the tracetools instrumentation layer that rclcpp already calls on every
publish and every callback, counts in-process with a lock-free hot path, and writes ready-to-read
Hz to a small rolling file.
What you get
# ts_ns=1782887153899445923 window_s=5.000
TOPIC /scan 20.000000                      # publish-side, inter-process
PUB   /points inter=0.000000 intra=30.000000   # publish-side incl. intra (Iron+)
RECV  /scan inter=20.000000 intra=0.000000 # receive-side, BOTH transports
RECV  /points inter=0.000000 intra=30.000000   # <- intra-process, invisible to other tools on Humble
JITTER /scan recv max_dt_ms=21.284             # largest inter-arrival gap (opt-in, see below)
NODE  /perception
NODE  /planner
WARN  TOPIC /scan hz=1.200000 expected=[18,22]  # only with an expected-rate spec (see below)
If a sidecar exporter or a log shipper is reading instead of a person, ROS_TOPIC_STATS_FORMAT=jsonl
writes every window as one JSON object per line with the same gates and values. See
JSON Lines output. Dashboards that already
read rclcpp’s built-in topic statistics get the same numbers on /statistics from the
pulse_bridge sidecar, and Prometheus, OTLP and
Grafana get them from pulse-export.
How it works
libros2_pulse.so is injected with LD_PRELOAD. It exports the same symbols as
libtracetools.so’s tracepoint API (ros_trace_rcl_publish, ros_trace_callback_start, the
init tracepoints and so on). The dynamic linker binds rclcpp’s calls to ours first; each
interposer records a stat and forwards to the real function through dlsym(RTLD_NEXT, ...).
rclcpp calls these functions unconditionally (the LTTng enable check is inside them), so the
probe works with no tracing session and adds no DDS traffic.
- Intra-process visibility comes from
callback_start(callback, is_intra_process), which fires for every subscription callback regardless of transport. - The hot path is a per-endpoint relaxed atomic increment behind a 256-slot thread-local cache with a stride-breaking hash. No global lock, no per-message string hashing. Counting costs about 0.3 ns/op on a fixed endpoint and 0.6 to 1.2 ns/op alternating across a working set on the reference box, two orders of magnitude under a single LTTng-UST tracepoint (about 158 ns).
- A background timer snapshots and resets the counts every
ROS_TOPIC_STATISTICS_PUBLISH_PERIODseconds and appends the rates toROS_TOPIC_STATS_OUTPUT_FILE.
The pure C++ core (core/) has no ROS dependency and is unit tested on its own; the probe layer
(probe/) is a thin LD_PRELOAD shim.
Install
apt
File truncated at 100 lines see the full file
Changelog
All notable changes to this project are documented here. Format follows Keep a Changelog; versions follow SemVer.
[Unreleased]
Fixed
-
pulse-top 0.4.1: pulse-top found no files on a default-format stack (issue #58). With the
probe in
.bashrcand noROS_TOPIC_STATS_FORMAT, every log is in the default text format. pulse-top parsed jsonl only, and it redrew the top bar only after a parsed window, so a directory of healthy text logs read “0 file(s)” forever even though the glob had matched them all. pulse-top and pulse-export now read the text format as well, sniffed per line like the C++log_reader, and a text window maps to the sameWindowits jsonl twin parses to (a line the probe did not print stays an absent field, never 0). The top bar is redrawn every tick, puts the file count before the path, and a notice line says why the table is empty: no file matches yet, N files found and waiting for the first window, or which files are not probe output. The follower now keeps blank lines, which close a text window, so no window arrives one period late. pulse-export’slines_skipped_totalcounts only lines that are in neither format. -
pulse-top 0.4.1:
--theme light|dark|terminalandPULSE_TOP_THEME(issue #59). The colours were hard-coded for a dark background, unreadable on the white terminals used outdoors.lightis black on white with warn colours picked to read on white (amber is brown, not yellow);terminalpaints nothing and uses the terminal’s own background and ANSI palette (Textual’sansi-darktheme);darkstays the default. The stylesheet now takes every colour from the Textual theme. The active tab’s label was invisible while the tab bar had focus (purple on purple) and is readable again. Textual floor raised to 8.2.7 for the ANSI theme. -
A publisher frozen by SIGSTOP read as a ~0 ms gap after it resumed. The flush timer
advanced its deadline one interval per fire, so when the whole probed process was frozen (the
flush thread with it) it replayed every missed tick back to back on SIGCONT: one window
carrying the stall, then a burst of ~0-length windows with a near-0
pub_max_dt_ms/recv_max_dt_msand nonsense Hz (50,000 Hz in one run). pulse-top and pulse-export keep the latest window, so a 5 s camera freeze showed as a 0.03 ms gap and thetopic_gapwarn was buried. The timer now re-phases instead of replaying: after a stall there is exactly one long window holding the full gap (5021 ms on the same repro), then normal cadence, and no window is ever shorter than half a period. Same fix on the receive side (a frozen subscriber process). The gap accounting itself was already right and is unchanged; the hot path is untouched. Regression testTimer.NoCatchUpBurstAfterStall.
Changed
- docs/ALTERNATIVES.md compares against NVIDIA’s
greenwave_monitor, the packaged subscriber-based monitor a Discourse reader said they were switching from; section plus a positioning-table row.
Added
-
pulse-top 0.4.0:
pulse-export, Prometheus / OTLP exporter and a Grafana example. A second entry point inros2-pulse-topthat tails the probe’s jsonl logs with pulse-top’s follower and parser and serves/metricsin the Prometheus text format on port 9464 from a stdlib HTTP server: per-topic publish and callback rate per path, largest gap,recv_lagdeficit, active warns, node up and last-seen age, per-process window period, age and timestamp, and window / warn / skipped-line counters, labelledpid(fromtopic_freq.<pid>.log),topic,node.--otlp URLpushes the same series as OTLP/HTTP JSON throughurllib(gauges, cumulative sums, UCUM units; checked against OpenTelemetry Collector 0.128.0). Absent keys stay absent series, never 0; a process that stops flushing loses its topic series after two periods and keeps a growing age. No new dependency.examples/grafana/holds a docker compose (exporter, Prometheus, Grafana) and a provisioned dashboard,--demoincluded; docs pagedocs/EXPORT.md.default_log_pathmoved fromapp.pytoreader.pyso the exporter does not import the TUI. 19 new pulse-top tests. -
pulse-top 0.3.0:
recv_lagwarn (issue #50). When a publisher’s process and a subscriber’s process are both probed, pulse-top pairs the topic’s publish rate (busier path) with its callback rate (inter + intra) and warns once the callbacks sit more than--lag-tol(default 10%) and more than two messages per window under the publish rate for--lag-windows(default 3) consecutive windows; it clears under half the tolerance and holds in between. A publish observation older than 1.5 periods cannot pair, so a dead or idle publisher (recv reads an explicit 0.0, KNOWN_ISSUES #12) is not lag; trackers are keyed by topic and source log, so a healthy subscriber process does not mask a lagging one, and a warn whose subscriber stopped flushing clears by time. Amber in the table (RECV cell), strip and Warns tab, with deficit, windows and source file in the sidebar; the text says the probe counts callbacks, not wire samples, so it cannot tell a drop from a backlog. Derived by the consumer: the probe, its output format, the spec grammar andpulse-checkare unchanged. Test node modeslow_listener <ms>andtest/integration/test_recv_lag.pyprove the two logs carry the gap and the model derives the warn from them; 21 new pulse-top tests. -
Blog post, “Watching a ROS 2 topic changes it”
(
docs/blog/2026-09-18-watching-a-ros2-topic-changes-it.md, on the docs site under Blog). The observer-effect bench written up for a systems-programming audience: what a subscriber costs (hz7 %,echo31 % of a core per watched 100 KB topic), whyhzon an intra-process topic switches serialization on in the watched process (+52 % CPU, 10/10 trials), howLD_PRELOADinterposition of theros_trace_*symbols counts in-process instead, and what that costs (+1.9 % ± 0.7 % paired). Every number cites its file and line in a trailing comment. Two figures underdocs/assets/blog/, regenerated from the committed CSV bybench/plot_observer_effect.py.site/build.pynow rewrites links relative to the page’s own directory (pages underblog/), and folds../in link targets, so a results page linking../../bench/RESULTS.mdlands on the benchmarks page instead of GitHub.
[0.5.0] - 2026-09-09
Adds an optional /statistics sidecar. The probe itself is unchanged.
Added
-
pulse_bridge(ros2 run ros2_pulse pulse_bridge): tails the probe’s jsonl log(s) and republishes every window on/statisticsasstatistics_msgs/MetricsMessage, in the shape rclcpp’s built-in topic statistics use (unitms,AVERAGE= message period,SAMPLE_COUNT,MAXIMUM= largest gap when measured), so existing consumers of that topic read pulse windows, intra-process included, with no integration work. Parameters:files,glob(default$TMPDIR/topic_freq.*.log, re-expanded every poll),topic,unit(ms|Hz),poll_period_s,source_name. Runs as its own process so the probe stays out of the DDS graph and free of rclcpp;package.xmlnow declaresrclcppandstatistics_msgsfor this executable only. Rate is measured at the subscription when the process has one, at the publisher otherwise; inter/intra report the busier path, never the sum. Text-format logs are refused with one warning per file. Asked for on ROS Discourse (topic 57637). -
core
metrics_mapperandline_follower: the window-to-sample mapping and the incremental line reader behind the bridge, ROS-free so both run in the standalone gtest lane
File truncated at 100 lines see the full file
Package Dependencies
| Deps | Name |
|---|---|
| ament_cmake | |
| ament_cmake_gtest | |
| ament_cmake_pytest | |
| rclpy | |
| std_msgs | |
| ros2run | |
| rclcpp | |
| statistics_msgs |
System Dependencies
| Name |
|---|
| lttng-tools |
Dependant Packages
Launch files
Messages
Services
Plugins
Recent questions tagged ros2_pulse at Robotics Stack Exchange
|
|
ros2_pulse package from ros2_pulse reporos2_pulse |
ROS Distro
|
Package Summary
| Version | 0.5.0 |
| License | Apache-2.0 |
| Build type | AMENT_CMAKE |
| Use | RECOMMENDED |
Repository Summary
| Checkout URI | https://github.com/TanayK07/ros2_pulse.git |
| VCS Type | git |
| VCS Version | main |
| Last Updated | 2026-10-02 |
| Dev Status | DEVELOPED |
| Released | RELEASED |
| Contributing |
Help Wanted (-)
Good First Issues (-) Pull Requests to Review (-) |
Package Description
Additional Links
Maintainers
- Tanay Kedia
Authors
ros2_pulse
The heartbeat of your ROS 2 graph. A low-overhead probe that measures per-topic message rate and active-node liveness for both inter-process and intra-process traffic, on stock ROS 2 binaries, with no rebuild, no privileges and no network traffic. The counting hot path costs under a nanosecond per message; the whole probe costs about 2 % of workload CPU on a harsh 4,900 msg/s stress and less on real graphs.
pulse-top --demo: the probe’s log, live. Sparklines per topic, intra-process rates, structured warnings with ages. Install: pip3 install ros2-pulse-top (details).
Forty seconds on what watching a topic costs and what the probe does instead. Watch the video (40 s, YouTube) or read the docs.
The long version, for systems programmers: Watching a ROS 2 topic changes it, the observer-effect measurement and the symbol-interposition trick that avoids it.
Why
The question in production is simple: is every topic flowing at the rate it should, and which nodes are alive? The existing tools each fall short of answering it.
-
ros2 topic hzandros2 topic echosubscribe to one topic at a time. Watching a single 100 KB topic costs 7 % of a core withhzand 31 % withecho, they cannot see intra-process messages at all, and pointinghzat an intra-process topic makes the publisher start serializing every message, which raised the watched process’s CPU by 52 % in our measurements. - Built-in topic statistics are
bypassed by intra-process comms on Humble-class
binaries, so composable nodes carrying point clouds lose all introspection. This is fixed on
rollingand newer by rclcpp#3130 (merged April 2026); there is no public Humble backport as of this writing. -
ros2_tracing/ LTTng is built for offline analysis: a session daemon plus post-processing of a CTF trace just to get a rate. On Humble it also needs ROS rebuilt with the lttng-ust backend (Jazzy and newer trace out of the box). - CARET (Tier IV) uses the same hook layer as this probe, LD_PRELOAD over tracetools, which is a useful independent validation of the mechanism. It is built for deep offline latency and chain analysis and needs LTTng, a forked rclcpp and Jupyter post-processing. Complementary, not always-on.
- eBPF uprobes need
CAP_SYS_ADMIN, debugfs and a kernel with BTF and uprobes, which is often a non-starter on Jetson and other embedded targets, and they pay a kernel trap per message.
ros2_pulse hooks the tracetools instrumentation layer that rclcpp already calls on every
publish and every callback, counts in-process with a lock-free hot path, and writes ready-to-read
Hz to a small rolling file.
What you get
# ts_ns=1782887153899445923 window_s=5.000
TOPIC /scan 20.000000                      # publish-side, inter-process
PUB   /points inter=0.000000 intra=30.000000   # publish-side incl. intra (Iron+)
RECV  /scan inter=20.000000 intra=0.000000 # receive-side, BOTH transports
RECV  /points inter=0.000000 intra=30.000000   # <- intra-process, invisible to other tools on Humble
JITTER /scan recv max_dt_ms=21.284             # largest inter-arrival gap (opt-in, see below)
NODE  /perception
NODE  /planner
WARN  TOPIC /scan hz=1.200000 expected=[18,22]  # only with an expected-rate spec (see below)
If a sidecar exporter or a log shipper is reading instead of a person, ROS_TOPIC_STATS_FORMAT=jsonl
writes every window as one JSON object per line with the same gates and values. See
JSON Lines output. Dashboards that already
read rclcpp’s built-in topic statistics get the same numbers on /statistics from the
pulse_bridge sidecar, and Prometheus, OTLP and
Grafana get them from pulse-export.
How it works
libros2_pulse.so is injected with LD_PRELOAD. It exports the same symbols as
libtracetools.so’s tracepoint API (ros_trace_rcl_publish, ros_trace_callback_start, the
init tracepoints and so on). The dynamic linker binds rclcpp’s calls to ours first; each
interposer records a stat and forwards to the real function through dlsym(RTLD_NEXT, ...).
rclcpp calls these functions unconditionally (the LTTng enable check is inside them), so the
probe works with no tracing session and adds no DDS traffic.
- Intra-process visibility comes from
callback_start(callback, is_intra_process), which fires for every subscription callback regardless of transport. - The hot path is a per-endpoint relaxed atomic increment behind a 256-slot thread-local cache with a stride-breaking hash. No global lock, no per-message string hashing. Counting costs about 0.3 ns/op on a fixed endpoint and 0.6 to 1.2 ns/op alternating across a working set on the reference box, two orders of magnitude under a single LTTng-UST tracepoint (about 158 ns).
- A background timer snapshots and resets the counts every
ROS_TOPIC_STATISTICS_PUBLISH_PERIODseconds and appends the rates toROS_TOPIC_STATS_OUTPUT_FILE.
The pure C++ core (core/) has no ROS dependency and is unit tested on its own; the probe layer
(probe/) is a thin LD_PRELOAD shim.
Install
apt
File truncated at 100 lines see the full file
Changelog
All notable changes to this project are documented here. Format follows Keep a Changelog; versions follow SemVer.
[Unreleased]
Fixed
-
pulse-top 0.4.1: pulse-top found no files on a default-format stack (issue #58). With the
probe in
.bashrcand noROS_TOPIC_STATS_FORMAT, every log is in the default text format. pulse-top parsed jsonl only, and it redrew the top bar only after a parsed window, so a directory of healthy text logs read “0 file(s)” forever even though the glob had matched them all. pulse-top and pulse-export now read the text format as well, sniffed per line like the C++log_reader, and a text window maps to the sameWindowits jsonl twin parses to (a line the probe did not print stays an absent field, never 0). The top bar is redrawn every tick, puts the file count before the path, and a notice line says why the table is empty: no file matches yet, N files found and waiting for the first window, or which files are not probe output. The follower now keeps blank lines, which close a text window, so no window arrives one period late. pulse-export’slines_skipped_totalcounts only lines that are in neither format. -
pulse-top 0.4.1:
--theme light|dark|terminalandPULSE_TOP_THEME(issue #59). The colours were hard-coded for a dark background, unreadable on the white terminals used outdoors.lightis black on white with warn colours picked to read on white (amber is brown, not yellow);terminalpaints nothing and uses the terminal’s own background and ANSI palette (Textual’sansi-darktheme);darkstays the default. The stylesheet now takes every colour from the Textual theme. The active tab’s label was invisible while the tab bar had focus (purple on purple) and is readable again. Textual floor raised to 8.2.7 for the ANSI theme. -
A publisher frozen by SIGSTOP read as a ~0 ms gap after it resumed. The flush timer
advanced its deadline one interval per fire, so when the whole probed process was frozen (the
flush thread with it) it replayed every missed tick back to back on SIGCONT: one window
carrying the stall, then a burst of ~0-length windows with a near-0
pub_max_dt_ms/recv_max_dt_msand nonsense Hz (50,000 Hz in one run). pulse-top and pulse-export keep the latest window, so a 5 s camera freeze showed as a 0.03 ms gap and thetopic_gapwarn was buried. The timer now re-phases instead of replaying: after a stall there is exactly one long window holding the full gap (5021 ms on the same repro), then normal cadence, and no window is ever shorter than half a period. Same fix on the receive side (a frozen subscriber process). The gap accounting itself was already right and is unchanged; the hot path is untouched. Regression testTimer.NoCatchUpBurstAfterStall.
Changed
- docs/ALTERNATIVES.md compares against NVIDIA’s
greenwave_monitor, the packaged subscriber-based monitor a Discourse reader said they were switching from; section plus a positioning-table row.
Added
-
pulse-top 0.4.0:
pulse-export, Prometheus / OTLP exporter and a Grafana example. A second entry point inros2-pulse-topthat tails the probe’s jsonl logs with pulse-top’s follower and parser and serves/metricsin the Prometheus text format on port 9464 from a stdlib HTTP server: per-topic publish and callback rate per path, largest gap,recv_lagdeficit, active warns, node up and last-seen age, per-process window period, age and timestamp, and window / warn / skipped-line counters, labelledpid(fromtopic_freq.<pid>.log),topic,node.--otlp URLpushes the same series as OTLP/HTTP JSON throughurllib(gauges, cumulative sums, UCUM units; checked against OpenTelemetry Collector 0.128.0). Absent keys stay absent series, never 0; a process that stops flushing loses its topic series after two periods and keeps a growing age. No new dependency.examples/grafana/holds a docker compose (exporter, Prometheus, Grafana) and a provisioned dashboard,--demoincluded; docs pagedocs/EXPORT.md.default_log_pathmoved fromapp.pytoreader.pyso the exporter does not import the TUI. 19 new pulse-top tests. -
pulse-top 0.3.0:
recv_lagwarn (issue #50). When a publisher’s process and a subscriber’s process are both probed, pulse-top pairs the topic’s publish rate (busier path) with its callback rate (inter + intra) and warns once the callbacks sit more than--lag-tol(default 10%) and more than two messages per window under the publish rate for--lag-windows(default 3) consecutive windows; it clears under half the tolerance and holds in between. A publish observation older than 1.5 periods cannot pair, so a dead or idle publisher (recv reads an explicit 0.0, KNOWN_ISSUES #12) is not lag; trackers are keyed by topic and source log, so a healthy subscriber process does not mask a lagging one, and a warn whose subscriber stopped flushing clears by time. Amber in the table (RECV cell), strip and Warns tab, with deficit, windows and source file in the sidebar; the text says the probe counts callbacks, not wire samples, so it cannot tell a drop from a backlog. Derived by the consumer: the probe, its output format, the spec grammar andpulse-checkare unchanged. Test node modeslow_listener <ms>andtest/integration/test_recv_lag.pyprove the two logs carry the gap and the model derives the warn from them; 21 new pulse-top tests. -
Blog post, “Watching a ROS 2 topic changes it”
(
docs/blog/2026-09-18-watching-a-ros2-topic-changes-it.md, on the docs site under Blog). The observer-effect bench written up for a systems-programming audience: what a subscriber costs (hz7 %,echo31 % of a core per watched 100 KB topic), whyhzon an intra-process topic switches serialization on in the watched process (+52 % CPU, 10/10 trials), howLD_PRELOADinterposition of theros_trace_*symbols counts in-process instead, and what that costs (+1.9 % ± 0.7 % paired). Every number cites its file and line in a trailing comment. Two figures underdocs/assets/blog/, regenerated from the committed CSV bybench/plot_observer_effect.py.site/build.pynow rewrites links relative to the page’s own directory (pages underblog/), and folds../in link targets, so a results page linking../../bench/RESULTS.mdlands on the benchmarks page instead of GitHub.
[0.5.0] - 2026-09-09
Adds an optional /statistics sidecar. The probe itself is unchanged.
Added
-
pulse_bridge(ros2 run ros2_pulse pulse_bridge): tails the probe’s jsonl log(s) and republishes every window on/statisticsasstatistics_msgs/MetricsMessage, in the shape rclcpp’s built-in topic statistics use (unitms,AVERAGE= message period,SAMPLE_COUNT,MAXIMUM= largest gap when measured), so existing consumers of that topic read pulse windows, intra-process included, with no integration work. Parameters:files,glob(default$TMPDIR/topic_freq.*.log, re-expanded every poll),topic,unit(ms|Hz),poll_period_s,source_name. Runs as its own process so the probe stays out of the DDS graph and free of rclcpp;package.xmlnow declaresrclcppandstatistics_msgsfor this executable only. Rate is measured at the subscription when the process has one, at the publisher otherwise; inter/intra report the busier path, never the sum. Text-format logs are refused with one warning per file. Asked for on ROS Discourse (topic 57637). -
core
metrics_mapperandline_follower: the window-to-sample mapping and the incremental line reader behind the bridge, ROS-free so both run in the standalone gtest lane
File truncated at 100 lines see the full file
Package Dependencies
| Deps | Name |
|---|---|
| ament_cmake | |
| ament_cmake_gtest | |
| ament_cmake_pytest | |
| rclpy | |
| std_msgs | |
| ros2run | |
| rclcpp | |
| statistics_msgs |
System Dependencies
| Name |
|---|
| lttng-tools |
Dependant Packages
Launch files
Messages
Services
Plugins
Recent questions tagged ros2_pulse at Robotics Stack Exchange
|
|
ros2_pulse package from ros2_pulse reporos2_pulse |
ROS Distro
|
Package Summary
| Version | 0.5.0 |
| License | Apache-2.0 |
| Build type | AMENT_CMAKE |
| Use | RECOMMENDED |
Repository Summary
| Checkout URI | https://github.com/TanayK07/ros2_pulse.git |
| VCS Type | git |
| VCS Version | main |
| Last Updated | 2026-10-02 |
| Dev Status | DEVELOPED |
| Released | RELEASED |
| Contributing |
Help Wanted (-)
Good First Issues (-) Pull Requests to Review (-) |
Package Description
Additional Links
Maintainers
- Tanay Kedia
Authors
ros2_pulse
The heartbeat of your ROS 2 graph. A low-overhead probe that measures per-topic message rate and active-node liveness for both inter-process and intra-process traffic, on stock ROS 2 binaries, with no rebuild, no privileges and no network traffic. The counting hot path costs under a nanosecond per message; the whole probe costs about 2 % of workload CPU on a harsh 4,900 msg/s stress and less on real graphs.
pulse-top --demo: the probe’s log, live. Sparklines per topic, intra-process rates, structured warnings with ages. Install: pip3 install ros2-pulse-top (details).
Forty seconds on what watching a topic costs and what the probe does instead. Watch the video (40 s, YouTube) or read the docs.
The long version, for systems programmers: Watching a ROS 2 topic changes it, the observer-effect measurement and the symbol-interposition trick that avoids it.
Why
The question in production is simple: is every topic flowing at the rate it should, and which nodes are alive? The existing tools each fall short of answering it.
-
ros2 topic hzandros2 topic echosubscribe to one topic at a time. Watching a single 100 KB topic costs 7 % of a core withhzand 31 % withecho, they cannot see intra-process messages at all, and pointinghzat an intra-process topic makes the publisher start serializing every message, which raised the watched process’s CPU by 52 % in our measurements. - Built-in topic statistics are
bypassed by intra-process comms on Humble-class
binaries, so composable nodes carrying point clouds lose all introspection. This is fixed on
rollingand newer by rclcpp#3130 (merged April 2026); there is no public Humble backport as of this writing. -
ros2_tracing/ LTTng is built for offline analysis: a session daemon plus post-processing of a CTF trace just to get a rate. On Humble it also needs ROS rebuilt with the lttng-ust backend (Jazzy and newer trace out of the box). - CARET (Tier IV) uses the same hook layer as this probe, LD_PRELOAD over tracetools, which is a useful independent validation of the mechanism. It is built for deep offline latency and chain analysis and needs LTTng, a forked rclcpp and Jupyter post-processing. Complementary, not always-on.
- eBPF uprobes need
CAP_SYS_ADMIN, debugfs and a kernel with BTF and uprobes, which is often a non-starter on Jetson and other embedded targets, and they pay a kernel trap per message.
ros2_pulse hooks the tracetools instrumentation layer that rclcpp already calls on every
publish and every callback, counts in-process with a lock-free hot path, and writes ready-to-read
Hz to a small rolling file.
What you get
# ts_ns=1782887153899445923 window_s=5.000
TOPIC /scan 20.000000                      # publish-side, inter-process
PUB   /points inter=0.000000 intra=30.000000   # publish-side incl. intra (Iron+)
RECV  /scan inter=20.000000 intra=0.000000 # receive-side, BOTH transports
RECV  /points inter=0.000000 intra=30.000000   # <- intra-process, invisible to other tools on Humble
JITTER /scan recv max_dt_ms=21.284             # largest inter-arrival gap (opt-in, see below)
NODE  /perception
NODE  /planner
WARN  TOPIC /scan hz=1.200000 expected=[18,22]  # only with an expected-rate spec (see below)
If a sidecar exporter or a log shipper is reading instead of a person, ROS_TOPIC_STATS_FORMAT=jsonl
writes every window as one JSON object per line with the same gates and values. See
JSON Lines output. Dashboards that already
read rclcpp’s built-in topic statistics get the same numbers on /statistics from the
pulse_bridge sidecar, and Prometheus, OTLP and
Grafana get them from pulse-export.
How it works
libros2_pulse.so is injected with LD_PRELOAD. It exports the same symbols as
libtracetools.so’s tracepoint API (ros_trace_rcl_publish, ros_trace_callback_start, the
init tracepoints and so on). The dynamic linker binds rclcpp’s calls to ours first; each
interposer records a stat and forwards to the real function through dlsym(RTLD_NEXT, ...).
rclcpp calls these functions unconditionally (the LTTng enable check is inside them), so the
probe works with no tracing session and adds no DDS traffic.
- Intra-process visibility comes from
callback_start(callback, is_intra_process), which fires for every subscription callback regardless of transport. - The hot path is a per-endpoint relaxed atomic increment behind a 256-slot thread-local cache with a stride-breaking hash. No global lock, no per-message string hashing. Counting costs about 0.3 ns/op on a fixed endpoint and 0.6 to 1.2 ns/op alternating across a working set on the reference box, two orders of magnitude under a single LTTng-UST tracepoint (about 158 ns).
- A background timer snapshots and resets the counts every
ROS_TOPIC_STATISTICS_PUBLISH_PERIODseconds and appends the rates toROS_TOPIC_STATS_OUTPUT_FILE.
The pure C++ core (core/) has no ROS dependency and is unit tested on its own; the probe layer
(probe/) is a thin LD_PRELOAD shim.
Install
apt
File truncated at 100 lines see the full file
Changelog
All notable changes to this project are documented here. Format follows Keep a Changelog; versions follow SemVer.
[Unreleased]
Fixed
-
pulse-top 0.4.1: pulse-top found no files on a default-format stack (issue #58). With the
probe in
.bashrcand noROS_TOPIC_STATS_FORMAT, every log is in the default text format. pulse-top parsed jsonl only, and it redrew the top bar only after a parsed window, so a directory of healthy text logs read “0 file(s)” forever even though the glob had matched them all. pulse-top and pulse-export now read the text format as well, sniffed per line like the C++log_reader, and a text window maps to the sameWindowits jsonl twin parses to (a line the probe did not print stays an absent field, never 0). The top bar is redrawn every tick, puts the file count before the path, and a notice line says why the table is empty: no file matches yet, N files found and waiting for the first window, or which files are not probe output. The follower now keeps blank lines, which close a text window, so no window arrives one period late. pulse-export’slines_skipped_totalcounts only lines that are in neither format. -
pulse-top 0.4.1:
--theme light|dark|terminalandPULSE_TOP_THEME(issue #59). The colours were hard-coded for a dark background, unreadable on the white terminals used outdoors.lightis black on white with warn colours picked to read on white (amber is brown, not yellow);terminalpaints nothing and uses the terminal’s own background and ANSI palette (Textual’sansi-darktheme);darkstays the default. The stylesheet now takes every colour from the Textual theme. The active tab’s label was invisible while the tab bar had focus (purple on purple) and is readable again. Textual floor raised to 8.2.7 for the ANSI theme. -
A publisher frozen by SIGSTOP read as a ~0 ms gap after it resumed. The flush timer
advanced its deadline one interval per fire, so when the whole probed process was frozen (the
flush thread with it) it replayed every missed tick back to back on SIGCONT: one window
carrying the stall, then a burst of ~0-length windows with a near-0
pub_max_dt_ms/recv_max_dt_msand nonsense Hz (50,000 Hz in one run). pulse-top and pulse-export keep the latest window, so a 5 s camera freeze showed as a 0.03 ms gap and thetopic_gapwarn was buried. The timer now re-phases instead of replaying: after a stall there is exactly one long window holding the full gap (5021 ms on the same repro), then normal cadence, and no window is ever shorter than half a period. Same fix on the receive side (a frozen subscriber process). The gap accounting itself was already right and is unchanged; the hot path is untouched. Regression testTimer.NoCatchUpBurstAfterStall.
Changed
- docs/ALTERNATIVES.md compares against NVIDIA’s
greenwave_monitor, the packaged subscriber-based monitor a Discourse reader said they were switching from; section plus a positioning-table row.
Added
-
pulse-top 0.4.0:
pulse-export, Prometheus / OTLP exporter and a Grafana example. A second entry point inros2-pulse-topthat tails the probe’s jsonl logs with pulse-top’s follower and parser and serves/metricsin the Prometheus text format on port 9464 from a stdlib HTTP server: per-topic publish and callback rate per path, largest gap,recv_lagdeficit, active warns, node up and last-seen age, per-process window period, age and timestamp, and window / warn / skipped-line counters, labelledpid(fromtopic_freq.<pid>.log),topic,node.--otlp URLpushes the same series as OTLP/HTTP JSON throughurllib(gauges, cumulative sums, UCUM units; checked against OpenTelemetry Collector 0.128.0). Absent keys stay absent series, never 0; a process that stops flushing loses its topic series after two periods and keeps a growing age. No new dependency.examples/grafana/holds a docker compose (exporter, Prometheus, Grafana) and a provisioned dashboard,--demoincluded; docs pagedocs/EXPORT.md.default_log_pathmoved fromapp.pytoreader.pyso the exporter does not import the TUI. 19 new pulse-top tests. -
pulse-top 0.3.0:
recv_lagwarn (issue #50). When a publisher’s process and a subscriber’s process are both probed, pulse-top pairs the topic’s publish rate (busier path) with its callback rate (inter + intra) and warns once the callbacks sit more than--lag-tol(default 10%) and more than two messages per window under the publish rate for--lag-windows(default 3) consecutive windows; it clears under half the tolerance and holds in between. A publish observation older than 1.5 periods cannot pair, so a dead or idle publisher (recv reads an explicit 0.0, KNOWN_ISSUES #12) is not lag; trackers are keyed by topic and source log, so a healthy subscriber process does not mask a lagging one, and a warn whose subscriber stopped flushing clears by time. Amber in the table (RECV cell), strip and Warns tab, with deficit, windows and source file in the sidebar; the text says the probe counts callbacks, not wire samples, so it cannot tell a drop from a backlog. Derived by the consumer: the probe, its output format, the spec grammar andpulse-checkare unchanged. Test node modeslow_listener <ms>andtest/integration/test_recv_lag.pyprove the two logs carry the gap and the model derives the warn from them; 21 new pulse-top tests. -
Blog post, “Watching a ROS 2 topic changes it”
(
docs/blog/2026-09-18-watching-a-ros2-topic-changes-it.md, on the docs site under Blog). The observer-effect bench written up for a systems-programming audience: what a subscriber costs (hz7 %,echo31 % of a core per watched 100 KB topic), whyhzon an intra-process topic switches serialization on in the watched process (+52 % CPU, 10/10 trials), howLD_PRELOADinterposition of theros_trace_*symbols counts in-process instead, and what that costs (+1.9 % ± 0.7 % paired). Every number cites its file and line in a trailing comment. Two figures underdocs/assets/blog/, regenerated from the committed CSV bybench/plot_observer_effect.py.site/build.pynow rewrites links relative to the page’s own directory (pages underblog/), and folds../in link targets, so a results page linking../../bench/RESULTS.mdlands on the benchmarks page instead of GitHub.
[0.5.0] - 2026-09-09
Adds an optional /statistics sidecar. The probe itself is unchanged.
Added
-
pulse_bridge(ros2 run ros2_pulse pulse_bridge): tails the probe’s jsonl log(s) and republishes every window on/statisticsasstatistics_msgs/MetricsMessage, in the shape rclcpp’s built-in topic statistics use (unitms,AVERAGE= message period,SAMPLE_COUNT,MAXIMUM= largest gap when measured), so existing consumers of that topic read pulse windows, intra-process included, with no integration work. Parameters:files,glob(default$TMPDIR/topic_freq.*.log, re-expanded every poll),topic,unit(ms|Hz),poll_period_s,source_name. Runs as its own process so the probe stays out of the DDS graph and free of rclcpp;package.xmlnow declaresrclcppandstatistics_msgsfor this executable only. Rate is measured at the subscription when the process has one, at the publisher otherwise; inter/intra report the busier path, never the sum. Text-format logs are refused with one warning per file. Asked for on ROS Discourse (topic 57637). -
core
metrics_mapperandline_follower: the window-to-sample mapping and the incremental line reader behind the bridge, ROS-free so both run in the standalone gtest lane
File truncated at 100 lines see the full file
Package Dependencies
| Deps | Name |
|---|---|
| ament_cmake | |
| ament_cmake_gtest | |
| ament_cmake_pytest | |
| rclpy | |
| std_msgs | |
| ros2run | |
| rclcpp | |
| statistics_msgs |
System Dependencies
| Name |
|---|
| lttng-tools |
Dependant Packages
Launch files
Messages
Services
Plugins
Recent questions tagged ros2_pulse at Robotics Stack Exchange
|
|
ros2_pulse package from ros2_pulse reporos2_pulse |
ROS Distro
|
Package Summary
| Version | 0.5.0 |
| License | Apache-2.0 |
| Build type | AMENT_CMAKE |
| Use | RECOMMENDED |
Repository Summary
| Checkout URI | https://github.com/TanayK07/ros2_pulse.git |
| VCS Type | git |
| VCS Version | main |
| Last Updated | 2026-10-02 |
| Dev Status | DEVELOPED |
| Released | RELEASED |
| Contributing |
Help Wanted (-)
Good First Issues (-) Pull Requests to Review (-) |
Package Description
Additional Links
Maintainers
- Tanay Kedia
Authors
ros2_pulse
The heartbeat of your ROS 2 graph. A low-overhead probe that measures per-topic message rate and active-node liveness for both inter-process and intra-process traffic, on stock ROS 2 binaries, with no rebuild, no privileges and no network traffic. The counting hot path costs under a nanosecond per message; the whole probe costs about 2 % of workload CPU on a harsh 4,900 msg/s stress and less on real graphs.
pulse-top --demo: the probe’s log, live. Sparklines per topic, intra-process rates, structured warnings with ages. Install: pip3 install ros2-pulse-top (details).
Forty seconds on what watching a topic costs and what the probe does instead. Watch the video (40 s, YouTube) or read the docs.
The long version, for systems programmers: Watching a ROS 2 topic changes it, the observer-effect measurement and the symbol-interposition trick that avoids it.
Why
The question in production is simple: is every topic flowing at the rate it should, and which nodes are alive? The existing tools each fall short of answering it.
-
ros2 topic hzandros2 topic echosubscribe to one topic at a time. Watching a single 100 KB topic costs 7 % of a core withhzand 31 % withecho, they cannot see intra-process messages at all, and pointinghzat an intra-process topic makes the publisher start serializing every message, which raised the watched process’s CPU by 52 % in our measurements. - Built-in topic statistics are
bypassed by intra-process comms on Humble-class
binaries, so composable nodes carrying point clouds lose all introspection. This is fixed on
rollingand newer by rclcpp#3130 (merged April 2026); there is no public Humble backport as of this writing. -
ros2_tracing/ LTTng is built for offline analysis: a session daemon plus post-processing of a CTF trace just to get a rate. On Humble it also needs ROS rebuilt with the lttng-ust backend (Jazzy and newer trace out of the box). - CARET (Tier IV) uses the same hook layer as this probe, LD_PRELOAD over tracetools, which is a useful independent validation of the mechanism. It is built for deep offline latency and chain analysis and needs LTTng, a forked rclcpp and Jupyter post-processing. Complementary, not always-on.
- eBPF uprobes need
CAP_SYS_ADMIN, debugfs and a kernel with BTF and uprobes, which is often a non-starter on Jetson and other embedded targets, and they pay a kernel trap per message.
ros2_pulse hooks the tracetools instrumentation layer that rclcpp already calls on every
publish and every callback, counts in-process with a lock-free hot path, and writes ready-to-read
Hz to a small rolling file.
What you get
# ts_ns=1782887153899445923 window_s=5.000
TOPIC /scan 20.000000                      # publish-side, inter-process
PUB   /points inter=0.000000 intra=30.000000   # publish-side incl. intra (Iron+)
RECV  /scan inter=20.000000 intra=0.000000 # receive-side, BOTH transports
RECV  /points inter=0.000000 intra=30.000000   # <- intra-process, invisible to other tools on Humble
JITTER /scan recv max_dt_ms=21.284             # largest inter-arrival gap (opt-in, see below)
NODE  /perception
NODE  /planner
WARN  TOPIC /scan hz=1.200000 expected=[18,22]  # only with an expected-rate spec (see below)
If a sidecar exporter or a log shipper is reading instead of a person, ROS_TOPIC_STATS_FORMAT=jsonl
writes every window as one JSON object per line with the same gates and values. See
JSON Lines output. Dashboards that already
read rclcpp’s built-in topic statistics get the same numbers on /statistics from the
pulse_bridge sidecar, and Prometheus, OTLP and
Grafana get them from pulse-export.
How it works
libros2_pulse.so is injected with LD_PRELOAD. It exports the same symbols as
libtracetools.so’s tracepoint API (ros_trace_rcl_publish, ros_trace_callback_start, the
init tracepoints and so on). The dynamic linker binds rclcpp’s calls to ours first; each
interposer records a stat and forwards to the real function through dlsym(RTLD_NEXT, ...).
rclcpp calls these functions unconditionally (the LTTng enable check is inside them), so the
probe works with no tracing session and adds no DDS traffic.
- Intra-process visibility comes from
callback_start(callback, is_intra_process), which fires for every subscription callback regardless of transport. - The hot path is a per-endpoint relaxed atomic increment behind a 256-slot thread-local cache with a stride-breaking hash. No global lock, no per-message string hashing. Counting costs about 0.3 ns/op on a fixed endpoint and 0.6 to 1.2 ns/op alternating across a working set on the reference box, two orders of magnitude under a single LTTng-UST tracepoint (about 158 ns).
- A background timer snapshots and resets the counts every
ROS_TOPIC_STATISTICS_PUBLISH_PERIODseconds and appends the rates toROS_TOPIC_STATS_OUTPUT_FILE.
The pure C++ core (core/) has no ROS dependency and is unit tested on its own; the probe layer
(probe/) is a thin LD_PRELOAD shim.
Install
apt
File truncated at 100 lines see the full file
Changelog
All notable changes to this project are documented here. Format follows Keep a Changelog; versions follow SemVer.
[Unreleased]
Fixed
-
pulse-top 0.4.1: pulse-top found no files on a default-format stack (issue #58). With the
probe in
.bashrcand noROS_TOPIC_STATS_FORMAT, every log is in the default text format. pulse-top parsed jsonl only, and it redrew the top bar only after a parsed window, so a directory of healthy text logs read “0 file(s)” forever even though the glob had matched them all. pulse-top and pulse-export now read the text format as well, sniffed per line like the C++log_reader, and a text window maps to the sameWindowits jsonl twin parses to (a line the probe did not print stays an absent field, never 0). The top bar is redrawn every tick, puts the file count before the path, and a notice line says why the table is empty: no file matches yet, N files found and waiting for the first window, or which files are not probe output. The follower now keeps blank lines, which close a text window, so no window arrives one period late. pulse-export’slines_skipped_totalcounts only lines that are in neither format. -
pulse-top 0.4.1:
--theme light|dark|terminalandPULSE_TOP_THEME(issue #59). The colours were hard-coded for a dark background, unreadable on the white terminals used outdoors.lightis black on white with warn colours picked to read on white (amber is brown, not yellow);terminalpaints nothing and uses the terminal’s own background and ANSI palette (Textual’sansi-darktheme);darkstays the default. The stylesheet now takes every colour from the Textual theme. The active tab’s label was invisible while the tab bar had focus (purple on purple) and is readable again. Textual floor raised to 8.2.7 for the ANSI theme. -
A publisher frozen by SIGSTOP read as a ~0 ms gap after it resumed. The flush timer
advanced its deadline one interval per fire, so when the whole probed process was frozen (the
flush thread with it) it replayed every missed tick back to back on SIGCONT: one window
carrying the stall, then a burst of ~0-length windows with a near-0
pub_max_dt_ms/recv_max_dt_msand nonsense Hz (50,000 Hz in one run). pulse-top and pulse-export keep the latest window, so a 5 s camera freeze showed as a 0.03 ms gap and thetopic_gapwarn was buried. The timer now re-phases instead of replaying: after a stall there is exactly one long window holding the full gap (5021 ms on the same repro), then normal cadence, and no window is ever shorter than half a period. Same fix on the receive side (a frozen subscriber process). The gap accounting itself was already right and is unchanged; the hot path is untouched. Regression testTimer.NoCatchUpBurstAfterStall.
Changed
- docs/ALTERNATIVES.md compares against NVIDIA’s
greenwave_monitor, the packaged subscriber-based monitor a Discourse reader said they were switching from; section plus a positioning-table row.
Added
-
pulse-top 0.4.0:
pulse-export, Prometheus / OTLP exporter and a Grafana example. A second entry point inros2-pulse-topthat tails the probe’s jsonl logs with pulse-top’s follower and parser and serves/metricsin the Prometheus text format on port 9464 from a stdlib HTTP server: per-topic publish and callback rate per path, largest gap,recv_lagdeficit, active warns, node up and last-seen age, per-process window period, age and timestamp, and window / warn / skipped-line counters, labelledpid(fromtopic_freq.<pid>.log),topic,node.--otlp URLpushes the same series as OTLP/HTTP JSON throughurllib(gauges, cumulative sums, UCUM units; checked against OpenTelemetry Collector 0.128.0). Absent keys stay absent series, never 0; a process that stops flushing loses its topic series after two periods and keeps a growing age. No new dependency.examples/grafana/holds a docker compose (exporter, Prometheus, Grafana) and a provisioned dashboard,--demoincluded; docs pagedocs/EXPORT.md.default_log_pathmoved fromapp.pytoreader.pyso the exporter does not import the TUI. 19 new pulse-top tests. -
pulse-top 0.3.0:
recv_lagwarn (issue #50). When a publisher’s process and a subscriber’s process are both probed, pulse-top pairs the topic’s publish rate (busier path) with its callback rate (inter + intra) and warns once the callbacks sit more than--lag-tol(default 10%) and more than two messages per window under the publish rate for--lag-windows(default 3) consecutive windows; it clears under half the tolerance and holds in between. A publish observation older than 1.5 periods cannot pair, so a dead or idle publisher (recv reads an explicit 0.0, KNOWN_ISSUES #12) is not lag; trackers are keyed by topic and source log, so a healthy subscriber process does not mask a lagging one, and a warn whose subscriber stopped flushing clears by time. Amber in the table (RECV cell), strip and Warns tab, with deficit, windows and source file in the sidebar; the text says the probe counts callbacks, not wire samples, so it cannot tell a drop from a backlog. Derived by the consumer: the probe, its output format, the spec grammar andpulse-checkare unchanged. Test node modeslow_listener <ms>andtest/integration/test_recv_lag.pyprove the two logs carry the gap and the model derives the warn from them; 21 new pulse-top tests. -
Blog post, “Watching a ROS 2 topic changes it”
(
docs/blog/2026-09-18-watching-a-ros2-topic-changes-it.md, on the docs site under Blog). The observer-effect bench written up for a systems-programming audience: what a subscriber costs (hz7 %,echo31 % of a core per watched 100 KB topic), whyhzon an intra-process topic switches serialization on in the watched process (+52 % CPU, 10/10 trials), howLD_PRELOADinterposition of theros_trace_*symbols counts in-process instead, and what that costs (+1.9 % ± 0.7 % paired). Every number cites its file and line in a trailing comment. Two figures underdocs/assets/blog/, regenerated from the committed CSV bybench/plot_observer_effect.py.site/build.pynow rewrites links relative to the page’s own directory (pages underblog/), and folds../in link targets, so a results page linking../../bench/RESULTS.mdlands on the benchmarks page instead of GitHub.
[0.5.0] - 2026-09-09
Adds an optional /statistics sidecar. The probe itself is unchanged.
Added
-
pulse_bridge(ros2 run ros2_pulse pulse_bridge): tails the probe’s jsonl log(s) and republishes every window on/statisticsasstatistics_msgs/MetricsMessage, in the shape rclcpp’s built-in topic statistics use (unitms,AVERAGE= message period,SAMPLE_COUNT,MAXIMUM= largest gap when measured), so existing consumers of that topic read pulse windows, intra-process included, with no integration work. Parameters:files,glob(default$TMPDIR/topic_freq.*.log, re-expanded every poll),topic,unit(ms|Hz),poll_period_s,source_name. Runs as its own process so the probe stays out of the DDS graph and free of rclcpp;package.xmlnow declaresrclcppandstatistics_msgsfor this executable only. Rate is measured at the subscription when the process has one, at the publisher otherwise; inter/intra report the busier path, never the sum. Text-format logs are refused with one warning per file. Asked for on ROS Discourse (topic 57637). -
core
metrics_mapperandline_follower: the window-to-sample mapping and the incremental line reader behind the bridge, ROS-free so both run in the standalone gtest lane
File truncated at 100 lines see the full file
Package Dependencies
| Deps | Name |
|---|---|
| ament_cmake | |
| ament_cmake_gtest | |
| ament_cmake_pytest | |
| rclpy | |
| std_msgs | |
| ros2run | |
| rclcpp | |
| statistics_msgs |
System Dependencies
| Name |
|---|
| lttng-tools |
Dependant Packages
Launch files
Messages
Services
Plugins
Recent questions tagged ros2_pulse at Robotics Stack Exchange
|
|
ros2_pulse package from ros2_pulse reporos2_pulse |
ROS Distro
|
Package Summary
| Version | 0.5.0 |
| License | Apache-2.0 |
| Build type | AMENT_CMAKE |
| Use | RECOMMENDED |
Repository Summary
| Checkout URI | https://github.com/TanayK07/ros2_pulse.git |
| VCS Type | git |
| VCS Version | main |
| Last Updated | 2026-10-02 |
| Dev Status | DEVELOPED |
| Released | RELEASED |
| Contributing |
Help Wanted (-)
Good First Issues (-) Pull Requests to Review (-) |
Package Description
Additional Links
Maintainers
- Tanay Kedia
Authors
ros2_pulse
The heartbeat of your ROS 2 graph. A low-overhead probe that measures per-topic message rate and active-node liveness for both inter-process and intra-process traffic, on stock ROS 2 binaries, with no rebuild, no privileges and no network traffic. The counting hot path costs under a nanosecond per message; the whole probe costs about 2 % of workload CPU on a harsh 4,900 msg/s stress and less on real graphs.
pulse-top --demo: the probe’s log, live. Sparklines per topic, intra-process rates, structured warnings with ages. Install: pip3 install ros2-pulse-top (details).
Forty seconds on what watching a topic costs and what the probe does instead. Watch the video (40 s, YouTube) or read the docs.
The long version, for systems programmers: Watching a ROS 2 topic changes it, the observer-effect measurement and the symbol-interposition trick that avoids it.
Why
The question in production is simple: is every topic flowing at the rate it should, and which nodes are alive? The existing tools each fall short of answering it.
-
ros2 topic hzandros2 topic echosubscribe to one topic at a time. Watching a single 100 KB topic costs 7 % of a core withhzand 31 % withecho, they cannot see intra-process messages at all, and pointinghzat an intra-process topic makes the publisher start serializing every message, which raised the watched process’s CPU by 52 % in our measurements. - Built-in topic statistics are
bypassed by intra-process comms on Humble-class
binaries, so composable nodes carrying point clouds lose all introspection. This is fixed on
rollingand newer by rclcpp#3130 (merged April 2026); there is no public Humble backport as of this writing. -
ros2_tracing/ LTTng is built for offline analysis: a session daemon plus post-processing of a CTF trace just to get a rate. On Humble it also needs ROS rebuilt with the lttng-ust backend (Jazzy and newer trace out of the box). - CARET (Tier IV) uses the same hook layer as this probe, LD_PRELOAD over tracetools, which is a useful independent validation of the mechanism. It is built for deep offline latency and chain analysis and needs LTTng, a forked rclcpp and Jupyter post-processing. Complementary, not always-on.
- eBPF uprobes need
CAP_SYS_ADMIN, debugfs and a kernel with BTF and uprobes, which is often a non-starter on Jetson and other embedded targets, and they pay a kernel trap per message.
ros2_pulse hooks the tracetools instrumentation layer that rclcpp already calls on every
publish and every callback, counts in-process with a lock-free hot path, and writes ready-to-read
Hz to a small rolling file.
What you get
# ts_ns=1782887153899445923 window_s=5.000
TOPIC /scan 20.000000                      # publish-side, inter-process
PUB   /points inter=0.000000 intra=30.000000   # publish-side incl. intra (Iron+)
RECV  /scan inter=20.000000 intra=0.000000 # receive-side, BOTH transports
RECV  /points inter=0.000000 intra=30.000000   # <- intra-process, invisible to other tools on Humble
JITTER /scan recv max_dt_ms=21.284             # largest inter-arrival gap (opt-in, see below)
NODE  /perception
NODE  /planner
WARN  TOPIC /scan hz=1.200000 expected=[18,22]  # only with an expected-rate spec (see below)
If a sidecar exporter or a log shipper is reading instead of a person, ROS_TOPIC_STATS_FORMAT=jsonl
writes every window as one JSON object per line with the same gates and values. See
JSON Lines output. Dashboards that already
read rclcpp’s built-in topic statistics get the same numbers on /statistics from the
pulse_bridge sidecar, and Prometheus, OTLP and
Grafana get them from pulse-export.
How it works
libros2_pulse.so is injected with LD_PRELOAD. It exports the same symbols as
libtracetools.so’s tracepoint API (ros_trace_rcl_publish, ros_trace_callback_start, the
init tracepoints and so on). The dynamic linker binds rclcpp’s calls to ours first; each
interposer records a stat and forwards to the real function through dlsym(RTLD_NEXT, ...).
rclcpp calls these functions unconditionally (the LTTng enable check is inside them), so the
probe works with no tracing session and adds no DDS traffic.
- Intra-process visibility comes from
callback_start(callback, is_intra_process), which fires for every subscription callback regardless of transport. - The hot path is a per-endpoint relaxed atomic increment behind a 256-slot thread-local cache with a stride-breaking hash. No global lock, no per-message string hashing. Counting costs about 0.3 ns/op on a fixed endpoint and 0.6 to 1.2 ns/op alternating across a working set on the reference box, two orders of magnitude under a single LTTng-UST tracepoint (about 158 ns).
- A background timer snapshots and resets the counts every
ROS_TOPIC_STATISTICS_PUBLISH_PERIODseconds and appends the rates toROS_TOPIC_STATS_OUTPUT_FILE.
The pure C++ core (core/) has no ROS dependency and is unit tested on its own; the probe layer
(probe/) is a thin LD_PRELOAD shim.
Install
apt
File truncated at 100 lines see the full file
Changelog
All notable changes to this project are documented here. Format follows Keep a Changelog; versions follow SemVer.
[Unreleased]
Fixed
-
pulse-top 0.4.1: pulse-top found no files on a default-format stack (issue #58). With the
probe in
.bashrcand noROS_TOPIC_STATS_FORMAT, every log is in the default text format. pulse-top parsed jsonl only, and it redrew the top bar only after a parsed window, so a directory of healthy text logs read “0 file(s)” forever even though the glob had matched them all. pulse-top and pulse-export now read the text format as well, sniffed per line like the C++log_reader, and a text window maps to the sameWindowits jsonl twin parses to (a line the probe did not print stays an absent field, never 0). The top bar is redrawn every tick, puts the file count before the path, and a notice line says why the table is empty: no file matches yet, N files found and waiting for the first window, or which files are not probe output. The follower now keeps blank lines, which close a text window, so no window arrives one period late. pulse-export’slines_skipped_totalcounts only lines that are in neither format. -
pulse-top 0.4.1:
--theme light|dark|terminalandPULSE_TOP_THEME(issue #59). The colours were hard-coded for a dark background, unreadable on the white terminals used outdoors.lightis black on white with warn colours picked to read on white (amber is brown, not yellow);terminalpaints nothing and uses the terminal’s own background and ANSI palette (Textual’sansi-darktheme);darkstays the default. The stylesheet now takes every colour from the Textual theme. The active tab’s label was invisible while the tab bar had focus (purple on purple) and is readable again. Textual floor raised to 8.2.7 for the ANSI theme. -
A publisher frozen by SIGSTOP read as a ~0 ms gap after it resumed. The flush timer
advanced its deadline one interval per fire, so when the whole probed process was frozen (the
flush thread with it) it replayed every missed tick back to back on SIGCONT: one window
carrying the stall, then a burst of ~0-length windows with a near-0
pub_max_dt_ms/recv_max_dt_msand nonsense Hz (50,000 Hz in one run). pulse-top and pulse-export keep the latest window, so a 5 s camera freeze showed as a 0.03 ms gap and thetopic_gapwarn was buried. The timer now re-phases instead of replaying: after a stall there is exactly one long window holding the full gap (5021 ms on the same repro), then normal cadence, and no window is ever shorter than half a period. Same fix on the receive side (a frozen subscriber process). The gap accounting itself was already right and is unchanged; the hot path is untouched. Regression testTimer.NoCatchUpBurstAfterStall.
Changed
- docs/ALTERNATIVES.md compares against NVIDIA’s
greenwave_monitor, the packaged subscriber-based monitor a Discourse reader said they were switching from; section plus a positioning-table row.
Added
-
pulse-top 0.4.0:
pulse-export, Prometheus / OTLP exporter and a Grafana example. A second entry point inros2-pulse-topthat tails the probe’s jsonl logs with pulse-top’s follower and parser and serves/metricsin the Prometheus text format on port 9464 from a stdlib HTTP server: per-topic publish and callback rate per path, largest gap,recv_lagdeficit, active warns, node up and last-seen age, per-process window period, age and timestamp, and window / warn / skipped-line counters, labelledpid(fromtopic_freq.<pid>.log),topic,node.--otlp URLpushes the same series as OTLP/HTTP JSON throughurllib(gauges, cumulative sums, UCUM units; checked against OpenTelemetry Collector 0.128.0). Absent keys stay absent series, never 0; a process that stops flushing loses its topic series after two periods and keeps a growing age. No new dependency.examples/grafana/holds a docker compose (exporter, Prometheus, Grafana) and a provisioned dashboard,--demoincluded; docs pagedocs/EXPORT.md.default_log_pathmoved fromapp.pytoreader.pyso the exporter does not import the TUI. 19 new pulse-top tests. -
pulse-top 0.3.0:
recv_lagwarn (issue #50). When a publisher’s process and a subscriber’s process are both probed, pulse-top pairs the topic’s publish rate (busier path) with its callback rate (inter + intra) and warns once the callbacks sit more than--lag-tol(default 10%) and more than two messages per window under the publish rate for--lag-windows(default 3) consecutive windows; it clears under half the tolerance and holds in between. A publish observation older than 1.5 periods cannot pair, so a dead or idle publisher (recv reads an explicit 0.0, KNOWN_ISSUES #12) is not lag; trackers are keyed by topic and source log, so a healthy subscriber process does not mask a lagging one, and a warn whose subscriber stopped flushing clears by time. Amber in the table (RECV cell), strip and Warns tab, with deficit, windows and source file in the sidebar; the text says the probe counts callbacks, not wire samples, so it cannot tell a drop from a backlog. Derived by the consumer: the probe, its output format, the spec grammar andpulse-checkare unchanged. Test node modeslow_listener <ms>andtest/integration/test_recv_lag.pyprove the two logs carry the gap and the model derives the warn from them; 21 new pulse-top tests. -
Blog post, “Watching a ROS 2 topic changes it”
(
docs/blog/2026-09-18-watching-a-ros2-topic-changes-it.md, on the docs site under Blog). The observer-effect bench written up for a systems-programming audience: what a subscriber costs (hz7 %,echo31 % of a core per watched 100 KB topic), whyhzon an intra-process topic switches serialization on in the watched process (+52 % CPU, 10/10 trials), howLD_PRELOADinterposition of theros_trace_*symbols counts in-process instead, and what that costs (+1.9 % ± 0.7 % paired). Every number cites its file and line in a trailing comment. Two figures underdocs/assets/blog/, regenerated from the committed CSV bybench/plot_observer_effect.py.site/build.pynow rewrites links relative to the page’s own directory (pages underblog/), and folds../in link targets, so a results page linking../../bench/RESULTS.mdlands on the benchmarks page instead of GitHub.
[0.5.0] - 2026-09-09
Adds an optional /statistics sidecar. The probe itself is unchanged.
Added
-
pulse_bridge(ros2 run ros2_pulse pulse_bridge): tails the probe’s jsonl log(s) and republishes every window on/statisticsasstatistics_msgs/MetricsMessage, in the shape rclcpp’s built-in topic statistics use (unitms,AVERAGE= message period,SAMPLE_COUNT,MAXIMUM= largest gap when measured), so existing consumers of that topic read pulse windows, intra-process included, with no integration work. Parameters:files,glob(default$TMPDIR/topic_freq.*.log, re-expanded every poll),topic,unit(ms|Hz),poll_period_s,source_name. Runs as its own process so the probe stays out of the DDS graph and free of rclcpp;package.xmlnow declaresrclcppandstatistics_msgsfor this executable only. Rate is measured at the subscription when the process has one, at the publisher otherwise; inter/intra report the busier path, never the sum. Text-format logs are refused with one warning per file. Asked for on ROS Discourse (topic 57637). -
core
metrics_mapperandline_follower: the window-to-sample mapping and the incremental line reader behind the bridge, ROS-free so both run in the standalone gtest lane
File truncated at 100 lines see the full file
Package Dependencies
| Deps | Name |
|---|---|
| ament_cmake | |
| ament_cmake_gtest | |
| ament_cmake_pytest | |
| rclpy | |
| std_msgs | |
| ros2run | |
| rclcpp | |
| statistics_msgs |
System Dependencies
| Name |
|---|
| lttng-tools |
Dependant Packages
Launch files
Messages
Services
Plugins
Recent questions tagged ros2_pulse at Robotics Stack Exchange
|
|
ros2_pulse package from ros2_pulse reporos2_pulse |
ROS Distro
|
Package Summary
| Version | 0.5.0 |
| License | Apache-2.0 |
| Build type | AMENT_CMAKE |
| Use | RECOMMENDED |
Repository Summary
| Checkout URI | https://github.com/TanayK07/ros2_pulse.git |
| VCS Type | git |
| VCS Version | main |
| Last Updated | 2026-10-02 |
| Dev Status | DEVELOPED |
| Released | RELEASED |
| Contributing |
Help Wanted (-)
Good First Issues (-) Pull Requests to Review (-) |
Package Description
Additional Links
Maintainers
- Tanay Kedia
Authors
ros2_pulse
The heartbeat of your ROS 2 graph. A low-overhead probe that measures per-topic message rate and active-node liveness for both inter-process and intra-process traffic, on stock ROS 2 binaries, with no rebuild, no privileges and no network traffic. The counting hot path costs under a nanosecond per message; the whole probe costs about 2 % of workload CPU on a harsh 4,900 msg/s stress and less on real graphs.
pulse-top --demo: the probe’s log, live. Sparklines per topic, intra-process rates, structured warnings with ages. Install: pip3 install ros2-pulse-top (details).
Forty seconds on what watching a topic costs and what the probe does instead. Watch the video (40 s, YouTube) or read the docs.
The long version, for systems programmers: Watching a ROS 2 topic changes it, the observer-effect measurement and the symbol-interposition trick that avoids it.
Why
The question in production is simple: is every topic flowing at the rate it should, and which nodes are alive? The existing tools each fall short of answering it.
-
ros2 topic hzandros2 topic echosubscribe to one topic at a time. Watching a single 100 KB topic costs 7 % of a core withhzand 31 % withecho, they cannot see intra-process messages at all, and pointinghzat an intra-process topic makes the publisher start serializing every message, which raised the watched process’s CPU by 52 % in our measurements. - Built-in topic statistics are
bypassed by intra-process comms on Humble-class
binaries, so composable nodes carrying point clouds lose all introspection. This is fixed on
rollingand newer by rclcpp#3130 (merged April 2026); there is no public Humble backport as of this writing. -
ros2_tracing/ LTTng is built for offline analysis: a session daemon plus post-processing of a CTF trace just to get a rate. On Humble it also needs ROS rebuilt with the lttng-ust backend (Jazzy and newer trace out of the box). - CARET (Tier IV) uses the same hook layer as this probe, LD_PRELOAD over tracetools, which is a useful independent validation of the mechanism. It is built for deep offline latency and chain analysis and needs LTTng, a forked rclcpp and Jupyter post-processing. Complementary, not always-on.
- eBPF uprobes need
CAP_SYS_ADMIN, debugfs and a kernel with BTF and uprobes, which is often a non-starter on Jetson and other embedded targets, and they pay a kernel trap per message.
ros2_pulse hooks the tracetools instrumentation layer that rclcpp already calls on every
publish and every callback, counts in-process with a lock-free hot path, and writes ready-to-read
Hz to a small rolling file.
What you get
# ts_ns=1782887153899445923 window_s=5.000
TOPIC /scan 20.000000                      # publish-side, inter-process
PUB   /points inter=0.000000 intra=30.000000   # publish-side incl. intra (Iron+)
RECV  /scan inter=20.000000 intra=0.000000 # receive-side, BOTH transports
RECV  /points inter=0.000000 intra=30.000000   # <- intra-process, invisible to other tools on Humble
JITTER /scan recv max_dt_ms=21.284             # largest inter-arrival gap (opt-in, see below)
NODE  /perception
NODE  /planner
WARN  TOPIC /scan hz=1.200000 expected=[18,22]  # only with an expected-rate spec (see below)
If a sidecar exporter or a log shipper is reading instead of a person, ROS_TOPIC_STATS_FORMAT=jsonl
writes every window as one JSON object per line with the same gates and values. See
JSON Lines output. Dashboards that already
read rclcpp’s built-in topic statistics get the same numbers on /statistics from the
pulse_bridge sidecar, and Prometheus, OTLP and
Grafana get them from pulse-export.
How it works
libros2_pulse.so is injected with LD_PRELOAD. It exports the same symbols as
libtracetools.so’s tracepoint API (ros_trace_rcl_publish, ros_trace_callback_start, the
init tracepoints and so on). The dynamic linker binds rclcpp’s calls to ours first; each
interposer records a stat and forwards to the real function through dlsym(RTLD_NEXT, ...).
rclcpp calls these functions unconditionally (the LTTng enable check is inside them), so the
probe works with no tracing session and adds no DDS traffic.
- Intra-process visibility comes from
callback_start(callback, is_intra_process), which fires for every subscription callback regardless of transport. - The hot path is a per-endpoint relaxed atomic increment behind a 256-slot thread-local cache with a stride-breaking hash. No global lock, no per-message string hashing. Counting costs about 0.3 ns/op on a fixed endpoint and 0.6 to 1.2 ns/op alternating across a working set on the reference box, two orders of magnitude under a single LTTng-UST tracepoint (about 158 ns).
- A background timer snapshots and resets the counts every
ROS_TOPIC_STATISTICS_PUBLISH_PERIODseconds and appends the rates toROS_TOPIC_STATS_OUTPUT_FILE.
The pure C++ core (core/) has no ROS dependency and is unit tested on its own; the probe layer
(probe/) is a thin LD_PRELOAD shim.
Install
apt
File truncated at 100 lines see the full file
Changelog
All notable changes to this project are documented here. Format follows Keep a Changelog; versions follow SemVer.
[Unreleased]
Fixed
-
pulse-top 0.4.1: pulse-top found no files on a default-format stack (issue #58). With the
probe in
.bashrcand noROS_TOPIC_STATS_FORMAT, every log is in the default text format. pulse-top parsed jsonl only, and it redrew the top bar only after a parsed window, so a directory of healthy text logs read “0 file(s)” forever even though the glob had matched them all. pulse-top and pulse-export now read the text format as well, sniffed per line like the C++log_reader, and a text window maps to the sameWindowits jsonl twin parses to (a line the probe did not print stays an absent field, never 0). The top bar is redrawn every tick, puts the file count before the path, and a notice line says why the table is empty: no file matches yet, N files found and waiting for the first window, or which files are not probe output. The follower now keeps blank lines, which close a text window, so no window arrives one period late. pulse-export’slines_skipped_totalcounts only lines that are in neither format. -
pulse-top 0.4.1:
--theme light|dark|terminalandPULSE_TOP_THEME(issue #59). The colours were hard-coded for a dark background, unreadable on the white terminals used outdoors.lightis black on white with warn colours picked to read on white (amber is brown, not yellow);terminalpaints nothing and uses the terminal’s own background and ANSI palette (Textual’sansi-darktheme);darkstays the default. The stylesheet now takes every colour from the Textual theme. The active tab’s label was invisible while the tab bar had focus (purple on purple) and is readable again. Textual floor raised to 8.2.7 for the ANSI theme. -
A publisher frozen by SIGSTOP read as a ~0 ms gap after it resumed. The flush timer
advanced its deadline one interval per fire, so when the whole probed process was frozen (the
flush thread with it) it replayed every missed tick back to back on SIGCONT: one window
carrying the stall, then a burst of ~0-length windows with a near-0
pub_max_dt_ms/recv_max_dt_msand nonsense Hz (50,000 Hz in one run). pulse-top and pulse-export keep the latest window, so a 5 s camera freeze showed as a 0.03 ms gap and thetopic_gapwarn was buried. The timer now re-phases instead of replaying: after a stall there is exactly one long window holding the full gap (5021 ms on the same repro), then normal cadence, and no window is ever shorter than half a period. Same fix on the receive side (a frozen subscriber process). The gap accounting itself was already right and is unchanged; the hot path is untouched. Regression testTimer.NoCatchUpBurstAfterStall.
Changed
- docs/ALTERNATIVES.md compares against NVIDIA’s
greenwave_monitor, the packaged subscriber-based monitor a Discourse reader said they were switching from; section plus a positioning-table row.
Added
-
pulse-top 0.4.0:
pulse-export, Prometheus / OTLP exporter and a Grafana example. A second entry point inros2-pulse-topthat tails the probe’s jsonl logs with pulse-top’s follower and parser and serves/metricsin the Prometheus text format on port 9464 from a stdlib HTTP server: per-topic publish and callback rate per path, largest gap,recv_lagdeficit, active warns, node up and last-seen age, per-process window period, age and timestamp, and window / warn / skipped-line counters, labelledpid(fromtopic_freq.<pid>.log),topic,node.--otlp URLpushes the same series as OTLP/HTTP JSON throughurllib(gauges, cumulative sums, UCUM units; checked against OpenTelemetry Collector 0.128.0). Absent keys stay absent series, never 0; a process that stops flushing loses its topic series after two periods and keeps a growing age. No new dependency.examples/grafana/holds a docker compose (exporter, Prometheus, Grafana) and a provisioned dashboard,--demoincluded; docs pagedocs/EXPORT.md.default_log_pathmoved fromapp.pytoreader.pyso the exporter does not import the TUI. 19 new pulse-top tests. -
pulse-top 0.3.0:
recv_lagwarn (issue #50). When a publisher’s process and a subscriber’s process are both probed, pulse-top pairs the topic’s publish rate (busier path) with its callback rate (inter + intra) and warns once the callbacks sit more than--lag-tol(default 10%) and more than two messages per window under the publish rate for--lag-windows(default 3) consecutive windows; it clears under half the tolerance and holds in between. A publish observation older than 1.5 periods cannot pair, so a dead or idle publisher (recv reads an explicit 0.0, KNOWN_ISSUES #12) is not lag; trackers are keyed by topic and source log, so a healthy subscriber process does not mask a lagging one, and a warn whose subscriber stopped flushing clears by time. Amber in the table (RECV cell), strip and Warns tab, with deficit, windows and source file in the sidebar; the text says the probe counts callbacks, not wire samples, so it cannot tell a drop from a backlog. Derived by the consumer: the probe, its output format, the spec grammar andpulse-checkare unchanged. Test node modeslow_listener <ms>andtest/integration/test_recv_lag.pyprove the two logs carry the gap and the model derives the warn from them; 21 new pulse-top tests. -
Blog post, “Watching a ROS 2 topic changes it”
(
docs/blog/2026-09-18-watching-a-ros2-topic-changes-it.md, on the docs site under Blog). The observer-effect bench written up for a systems-programming audience: what a subscriber costs (hz7 %,echo31 % of a core per watched 100 KB topic), whyhzon an intra-process topic switches serialization on in the watched process (+52 % CPU, 10/10 trials), howLD_PRELOADinterposition of theros_trace_*symbols counts in-process instead, and what that costs (+1.9 % ± 0.7 % paired). Every number cites its file and line in a trailing comment. Two figures underdocs/assets/blog/, regenerated from the committed CSV bybench/plot_observer_effect.py.site/build.pynow rewrites links relative to the page’s own directory (pages underblog/), and folds../in link targets, so a results page linking../../bench/RESULTS.mdlands on the benchmarks page instead of GitHub.
[0.5.0] - 2026-09-09
Adds an optional /statistics sidecar. The probe itself is unchanged.
Added
-
pulse_bridge(ros2 run ros2_pulse pulse_bridge): tails the probe’s jsonl log(s) and republishes every window on/statisticsasstatistics_msgs/MetricsMessage, in the shape rclcpp’s built-in topic statistics use (unitms,AVERAGE= message period,SAMPLE_COUNT,MAXIMUM= largest gap when measured), so existing consumers of that topic read pulse windows, intra-process included, with no integration work. Parameters:files,glob(default$TMPDIR/topic_freq.*.log, re-expanded every poll),topic,unit(ms|Hz),poll_period_s,source_name. Runs as its own process so the probe stays out of the DDS graph and free of rclcpp;package.xmlnow declaresrclcppandstatistics_msgsfor this executable only. Rate is measured at the subscription when the process has one, at the publisher otherwise; inter/intra report the busier path, never the sum. Text-format logs are refused with one warning per file. Asked for on ROS Discourse (topic 57637). -
core
metrics_mapperandline_follower: the window-to-sample mapping and the incremental line reader behind the bridge, ROS-free so both run in the standalone gtest lane
File truncated at 100 lines see the full file
Package Dependencies
| Deps | Name |
|---|---|
| ament_cmake | |
| ament_cmake_gtest | |
| ament_cmake_pytest | |
| rclpy | |
| std_msgs | |
| ros2run | |
| rclcpp | |
| statistics_msgs |
System Dependencies
| Name |
|---|
| lttng-tools |
Dependant Packages
Launch files
Messages
Services
Plugins
Recent questions tagged ros2_pulse at Robotics Stack Exchange
|
|
ros2_pulse package from ros2_pulse reporos2_pulse |
ROS Distro
|
Package Summary
| Version | 0.5.0 |
| License | Apache-2.0 |
| Build type | AMENT_CMAKE |
| Use | RECOMMENDED |
Repository Summary
| Checkout URI | https://github.com/TanayK07/ros2_pulse.git |
| VCS Type | git |
| VCS Version | main |
| Last Updated | 2026-10-02 |
| Dev Status | DEVELOPED |
| Released | RELEASED |
| Contributing |
Help Wanted (-)
Good First Issues (-) Pull Requests to Review (-) |
Package Description
Additional Links
Maintainers
- Tanay Kedia
Authors
ros2_pulse
The heartbeat of your ROS 2 graph. A low-overhead probe that measures per-topic message rate and active-node liveness for both inter-process and intra-process traffic, on stock ROS 2 binaries, with no rebuild, no privileges and no network traffic. The counting hot path costs under a nanosecond per message; the whole probe costs about 2 % of workload CPU on a harsh 4,900 msg/s stress and less on real graphs.
pulse-top --demo: the probe’s log, live. Sparklines per topic, intra-process rates, structured warnings with ages. Install: pip3 install ros2-pulse-top (details).
Forty seconds on what watching a topic costs and what the probe does instead. Watch the video (40 s, YouTube) or read the docs.
The long version, for systems programmers: Watching a ROS 2 topic changes it, the observer-effect measurement and the symbol-interposition trick that avoids it.
Why
The question in production is simple: is every topic flowing at the rate it should, and which nodes are alive? The existing tools each fall short of answering it.
-
ros2 topic hzandros2 topic echosubscribe to one topic at a time. Watching a single 100 KB topic costs 7 % of a core withhzand 31 % withecho, they cannot see intra-process messages at all, and pointinghzat an intra-process topic makes the publisher start serializing every message, which raised the watched process’s CPU by 52 % in our measurements. - Built-in topic statistics are
bypassed by intra-process comms on Humble-class
binaries, so composable nodes carrying point clouds lose all introspection. This is fixed on
rollingand newer by rclcpp#3130 (merged April 2026); there is no public Humble backport as of this writing. -
ros2_tracing/ LTTng is built for offline analysis: a session daemon plus post-processing of a CTF trace just to get a rate. On Humble it also needs ROS rebuilt with the lttng-ust backend (Jazzy and newer trace out of the box). - CARET (Tier IV) uses the same hook layer as this probe, LD_PRELOAD over tracetools, which is a useful independent validation of the mechanism. It is built for deep offline latency and chain analysis and needs LTTng, a forked rclcpp and Jupyter post-processing. Complementary, not always-on.
- eBPF uprobes need
CAP_SYS_ADMIN, debugfs and a kernel with BTF and uprobes, which is often a non-starter on Jetson and other embedded targets, and they pay a kernel trap per message.
ros2_pulse hooks the tracetools instrumentation layer that rclcpp already calls on every
publish and every callback, counts in-process with a lock-free hot path, and writes ready-to-read
Hz to a small rolling file.
What you get
# ts_ns=1782887153899445923 window_s=5.000
TOPIC /scan 20.000000                      # publish-side, inter-process
PUB   /points inter=0.000000 intra=30.000000   # publish-side incl. intra (Iron+)
RECV  /scan inter=20.000000 intra=0.000000 # receive-side, BOTH transports
RECV  /points inter=0.000000 intra=30.000000   # <- intra-process, invisible to other tools on Humble
JITTER /scan recv max_dt_ms=21.284             # largest inter-arrival gap (opt-in, see below)
NODE  /perception
NODE  /planner
WARN  TOPIC /scan hz=1.200000 expected=[18,22]  # only with an expected-rate spec (see below)
If a sidecar exporter or a log shipper is reading instead of a person, ROS_TOPIC_STATS_FORMAT=jsonl
writes every window as one JSON object per line with the same gates and values. See
JSON Lines output. Dashboards that already
read rclcpp’s built-in topic statistics get the same numbers on /statistics from the
pulse_bridge sidecar, and Prometheus, OTLP and
Grafana get them from pulse-export.
How it works
libros2_pulse.so is injected with LD_PRELOAD. It exports the same symbols as
libtracetools.so’s tracepoint API (ros_trace_rcl_publish, ros_trace_callback_start, the
init tracepoints and so on). The dynamic linker binds rclcpp’s calls to ours first; each
interposer records a stat and forwards to the real function through dlsym(RTLD_NEXT, ...).
rclcpp calls these functions unconditionally (the LTTng enable check is inside them), so the
probe works with no tracing session and adds no DDS traffic.
- Intra-process visibility comes from
callback_start(callback, is_intra_process), which fires for every subscription callback regardless of transport. - The hot path is a per-endpoint relaxed atomic increment behind a 256-slot thread-local cache with a stride-breaking hash. No global lock, no per-message string hashing. Counting costs about 0.3 ns/op on a fixed endpoint and 0.6 to 1.2 ns/op alternating across a working set on the reference box, two orders of magnitude under a single LTTng-UST tracepoint (about 158 ns).
- A background timer snapshots and resets the counts every
ROS_TOPIC_STATISTICS_PUBLISH_PERIODseconds and appends the rates toROS_TOPIC_STATS_OUTPUT_FILE.
The pure C++ core (core/) has no ROS dependency and is unit tested on its own; the probe layer
(probe/) is a thin LD_PRELOAD shim.
Install
apt
File truncated at 100 lines see the full file
Changelog
All notable changes to this project are documented here. Format follows Keep a Changelog; versions follow SemVer.
[Unreleased]
Fixed
-
pulse-top 0.4.1: pulse-top found no files on a default-format stack (issue #58). With the
probe in
.bashrcand noROS_TOPIC_STATS_FORMAT, every log is in the default text format. pulse-top parsed jsonl only, and it redrew the top bar only after a parsed window, so a directory of healthy text logs read “0 file(s)” forever even though the glob had matched them all. pulse-top and pulse-export now read the text format as well, sniffed per line like the C++log_reader, and a text window maps to the sameWindowits jsonl twin parses to (a line the probe did not print stays an absent field, never 0). The top bar is redrawn every tick, puts the file count before the path, and a notice line says why the table is empty: no file matches yet, N files found and waiting for the first window, or which files are not probe output. The follower now keeps blank lines, which close a text window, so no window arrives one period late. pulse-export’slines_skipped_totalcounts only lines that are in neither format. -
pulse-top 0.4.1:
--theme light|dark|terminalandPULSE_TOP_THEME(issue #59). The colours were hard-coded for a dark background, unreadable on the white terminals used outdoors.lightis black on white with warn colours picked to read on white (amber is brown, not yellow);terminalpaints nothing and uses the terminal’s own background and ANSI palette (Textual’sansi-darktheme);darkstays the default. The stylesheet now takes every colour from the Textual theme. The active tab’s label was invisible while the tab bar had focus (purple on purple) and is readable again. Textual floor raised to 8.2.7 for the ANSI theme. -
A publisher frozen by SIGSTOP read as a ~0 ms gap after it resumed. The flush timer
advanced its deadline one interval per fire, so when the whole probed process was frozen (the
flush thread with it) it replayed every missed tick back to back on SIGCONT: one window
carrying the stall, then a burst of ~0-length windows with a near-0
pub_max_dt_ms/recv_max_dt_msand nonsense Hz (50,000 Hz in one run). pulse-top and pulse-export keep the latest window, so a 5 s camera freeze showed as a 0.03 ms gap and thetopic_gapwarn was buried. The timer now re-phases instead of replaying: after a stall there is exactly one long window holding the full gap (5021 ms on the same repro), then normal cadence, and no window is ever shorter than half a period. Same fix on the receive side (a frozen subscriber process). The gap accounting itself was already right and is unchanged; the hot path is untouched. Regression testTimer.NoCatchUpBurstAfterStall.
Changed
- docs/ALTERNATIVES.md compares against NVIDIA’s
greenwave_monitor, the packaged subscriber-based monitor a Discourse reader said they were switching from; section plus a positioning-table row.
Added
-
pulse-top 0.4.0:
pulse-export, Prometheus / OTLP exporter and a Grafana example. A second entry point inros2-pulse-topthat tails the probe’s jsonl logs with pulse-top’s follower and parser and serves/metricsin the Prometheus text format on port 9464 from a stdlib HTTP server: per-topic publish and callback rate per path, largest gap,recv_lagdeficit, active warns, node up and last-seen age, per-process window period, age and timestamp, and window / warn / skipped-line counters, labelledpid(fromtopic_freq.<pid>.log),topic,node.--otlp URLpushes the same series as OTLP/HTTP JSON throughurllib(gauges, cumulative sums, UCUM units; checked against OpenTelemetry Collector 0.128.0). Absent keys stay absent series, never 0; a process that stops flushing loses its topic series after two periods and keeps a growing age. No new dependency.examples/grafana/holds a docker compose (exporter, Prometheus, Grafana) and a provisioned dashboard,--demoincluded; docs pagedocs/EXPORT.md.default_log_pathmoved fromapp.pytoreader.pyso the exporter does not import the TUI. 19 new pulse-top tests. -
pulse-top 0.3.0:
recv_lagwarn (issue #50). When a publisher’s process and a subscriber’s process are both probed, pulse-top pairs the topic’s publish rate (busier path) with its callback rate (inter + intra) and warns once the callbacks sit more than--lag-tol(default 10%) and more than two messages per window under the publish rate for--lag-windows(default 3) consecutive windows; it clears under half the tolerance and holds in between. A publish observation older than 1.5 periods cannot pair, so a dead or idle publisher (recv reads an explicit 0.0, KNOWN_ISSUES #12) is not lag; trackers are keyed by topic and source log, so a healthy subscriber process does not mask a lagging one, and a warn whose subscriber stopped flushing clears by time. Amber in the table (RECV cell), strip and Warns tab, with deficit, windows and source file in the sidebar; the text says the probe counts callbacks, not wire samples, so it cannot tell a drop from a backlog. Derived by the consumer: the probe, its output format, the spec grammar andpulse-checkare unchanged. Test node modeslow_listener <ms>andtest/integration/test_recv_lag.pyprove the two logs carry the gap and the model derives the warn from them; 21 new pulse-top tests. -
Blog post, “Watching a ROS 2 topic changes it”
(
docs/blog/2026-09-18-watching-a-ros2-topic-changes-it.md, on the docs site under Blog). The observer-effect bench written up for a systems-programming audience: what a subscriber costs (hz7 %,echo31 % of a core per watched 100 KB topic), whyhzon an intra-process topic switches serialization on in the watched process (+52 % CPU, 10/10 trials), howLD_PRELOADinterposition of theros_trace_*symbols counts in-process instead, and what that costs (+1.9 % ± 0.7 % paired). Every number cites its file and line in a trailing comment. Two figures underdocs/assets/blog/, regenerated from the committed CSV bybench/plot_observer_effect.py.site/build.pynow rewrites links relative to the page’s own directory (pages underblog/), and folds../in link targets, so a results page linking../../bench/RESULTS.mdlands on the benchmarks page instead of GitHub.
[0.5.0] - 2026-09-09
Adds an optional /statistics sidecar. The probe itself is unchanged.
Added
-
pulse_bridge(ros2 run ros2_pulse pulse_bridge): tails the probe’s jsonl log(s) and republishes every window on/statisticsasstatistics_msgs/MetricsMessage, in the shape rclcpp’s built-in topic statistics use (unitms,AVERAGE= message period,SAMPLE_COUNT,MAXIMUM= largest gap when measured), so existing consumers of that topic read pulse windows, intra-process included, with no integration work. Parameters:files,glob(default$TMPDIR/topic_freq.*.log, re-expanded every poll),topic,unit(ms|Hz),poll_period_s,source_name. Runs as its own process so the probe stays out of the DDS graph and free of rclcpp;package.xmlnow declaresrclcppandstatistics_msgsfor this executable only. Rate is measured at the subscription when the process has one, at the publisher otherwise; inter/intra report the busier path, never the sum. Text-format logs are refused with one warning per file. Asked for on ROS Discourse (topic 57637). -
core
metrics_mapperandline_follower: the window-to-sample mapping and the incremental line reader behind the bridge, ROS-free so both run in the standalone gtest lane
File truncated at 100 lines see the full file
Package Dependencies
| Deps | Name |
|---|---|
| ament_cmake | |
| ament_cmake_gtest | |
| ament_cmake_pytest | |
| rclpy | |
| std_msgs | |
| ros2run | |
| rclcpp | |
| statistics_msgs |
System Dependencies
| Name |
|---|
| lttng-tools |
Dependant Packages
Launch files
Messages
Services
Plugins
Recent questions tagged ros2_pulse at Robotics Stack Exchange
|
|
ros2_pulse package from ros2_pulse reporos2_pulse |
ROS Distro
|
Package Summary
| Version | 0.5.0 |
| License | Apache-2.0 |
| Build type | AMENT_CMAKE |
| Use | RECOMMENDED |
Repository Summary
| Checkout URI | https://github.com/TanayK07/ros2_pulse.git |
| VCS Type | git |
| VCS Version | main |
| Last Updated | 2026-10-02 |
| Dev Status | DEVELOPED |
| Released | RELEASED |
| Contributing |
Help Wanted (-)
Good First Issues (-) Pull Requests to Review (-) |
Package Description
Additional Links
Maintainers
- Tanay Kedia
Authors
ros2_pulse
The heartbeat of your ROS 2 graph. A low-overhead probe that measures per-topic message rate and active-node liveness for both inter-process and intra-process traffic, on stock ROS 2 binaries, with no rebuild, no privileges and no network traffic. The counting hot path costs under a nanosecond per message; the whole probe costs about 2 % of workload CPU on a harsh 4,900 msg/s stress and less on real graphs.
pulse-top --demo: the probe’s log, live. Sparklines per topic, intra-process rates, structured warnings with ages. Install: pip3 install ros2-pulse-top (details).
Forty seconds on what watching a topic costs and what the probe does instead. Watch the video (40 s, YouTube) or read the docs.
The long version, for systems programmers: Watching a ROS 2 topic changes it, the observer-effect measurement and the symbol-interposition trick that avoids it.
Why
The question in production is simple: is every topic flowing at the rate it should, and which nodes are alive? The existing tools each fall short of answering it.
-
ros2 topic hzandros2 topic echosubscribe to one topic at a time. Watching a single 100 KB topic costs 7 % of a core withhzand 31 % withecho, they cannot see intra-process messages at all, and pointinghzat an intra-process topic makes the publisher start serializing every message, which raised the watched process’s CPU by 52 % in our measurements. - Built-in topic statistics are
bypassed by intra-process comms on Humble-class
binaries, so composable nodes carrying point clouds lose all introspection. This is fixed on
rollingand newer by rclcpp#3130 (merged April 2026); there is no public Humble backport as of this writing. -
ros2_tracing/ LTTng is built for offline analysis: a session daemon plus post-processing of a CTF trace just to get a rate. On Humble it also needs ROS rebuilt with the lttng-ust backend (Jazzy and newer trace out of the box). - CARET (Tier IV) uses the same hook layer as this probe, LD_PRELOAD over tracetools, which is a useful independent validation of the mechanism. It is built for deep offline latency and chain analysis and needs LTTng, a forked rclcpp and Jupyter post-processing. Complementary, not always-on.
- eBPF uprobes need
CAP_SYS_ADMIN, debugfs and a kernel with BTF and uprobes, which is often a non-starter on Jetson and other embedded targets, and they pay a kernel trap per message.
ros2_pulse hooks the tracetools instrumentation layer that rclcpp already calls on every
publish and every callback, counts in-process with a lock-free hot path, and writes ready-to-read
Hz to a small rolling file.
What you get
# ts_ns=1782887153899445923 window_s=5.000
TOPIC /scan 20.000000                      # publish-side, inter-process
PUB   /points inter=0.000000 intra=30.000000   # publish-side incl. intra (Iron+)
RECV  /scan inter=20.000000 intra=0.000000 # receive-side, BOTH transports
RECV  /points inter=0.000000 intra=30.000000   # <- intra-process, invisible to other tools on Humble
JITTER /scan recv max_dt_ms=21.284             # largest inter-arrival gap (opt-in, see below)
NODE  /perception
NODE  /planner
WARN  TOPIC /scan hz=1.200000 expected=[18,22]  # only with an expected-rate spec (see below)
If a sidecar exporter or a log shipper is reading instead of a person, ROS_TOPIC_STATS_FORMAT=jsonl
writes every window as one JSON object per line with the same gates and values. See
JSON Lines output. Dashboards that already
read rclcpp’s built-in topic statistics get the same numbers on /statistics from the
pulse_bridge sidecar, and Prometheus, OTLP and
Grafana get them from pulse-export.
How it works
libros2_pulse.so is injected with LD_PRELOAD. It exports the same symbols as
libtracetools.so’s tracepoint API (ros_trace_rcl_publish, ros_trace_callback_start, the
init tracepoints and so on). The dynamic linker binds rclcpp’s calls to ours first; each
interposer records a stat and forwards to the real function through dlsym(RTLD_NEXT, ...).
rclcpp calls these functions unconditionally (the LTTng enable check is inside them), so the
probe works with no tracing session and adds no DDS traffic.
- Intra-process visibility comes from
callback_start(callback, is_intra_process), which fires for every subscription callback regardless of transport. - The hot path is a per-endpoint relaxed atomic increment behind a 256-slot thread-local cache with a stride-breaking hash. No global lock, no per-message string hashing. Counting costs about 0.3 ns/op on a fixed endpoint and 0.6 to 1.2 ns/op alternating across a working set on the reference box, two orders of magnitude under a single LTTng-UST tracepoint (about 158 ns).
- A background timer snapshots and resets the counts every
ROS_TOPIC_STATISTICS_PUBLISH_PERIODseconds and appends the rates toROS_TOPIC_STATS_OUTPUT_FILE.
The pure C++ core (core/) has no ROS dependency and is unit tested on its own; the probe layer
(probe/) is a thin LD_PRELOAD shim.
Install
apt
File truncated at 100 lines see the full file
Changelog
All notable changes to this project are documented here. Format follows Keep a Changelog; versions follow SemVer.
[Unreleased]
Fixed
-
pulse-top 0.4.1: pulse-top found no files on a default-format stack (issue #58). With the
probe in
.bashrcand noROS_TOPIC_STATS_FORMAT, every log is in the default text format. pulse-top parsed jsonl only, and it redrew the top bar only after a parsed window, so a directory of healthy text logs read “0 file(s)” forever even though the glob had matched them all. pulse-top and pulse-export now read the text format as well, sniffed per line like the C++log_reader, and a text window maps to the sameWindowits jsonl twin parses to (a line the probe did not print stays an absent field, never 0). The top bar is redrawn every tick, puts the file count before the path, and a notice line says why the table is empty: no file matches yet, N files found and waiting for the first window, or which files are not probe output. The follower now keeps blank lines, which close a text window, so no window arrives one period late. pulse-export’slines_skipped_totalcounts only lines that are in neither format. -
pulse-top 0.4.1:
--theme light|dark|terminalandPULSE_TOP_THEME(issue #59). The colours were hard-coded for a dark background, unreadable on the white terminals used outdoors.lightis black on white with warn colours picked to read on white (amber is brown, not yellow);terminalpaints nothing and uses the terminal’s own background and ANSI palette (Textual’sansi-darktheme);darkstays the default. The stylesheet now takes every colour from the Textual theme. The active tab’s label was invisible while the tab bar had focus (purple on purple) and is readable again. Textual floor raised to 8.2.7 for the ANSI theme. -
A publisher frozen by SIGSTOP read as a ~0 ms gap after it resumed. The flush timer
advanced its deadline one interval per fire, so when the whole probed process was frozen (the
flush thread with it) it replayed every missed tick back to back on SIGCONT: one window
carrying the stall, then a burst of ~0-length windows with a near-0
pub_max_dt_ms/recv_max_dt_msand nonsense Hz (50,000 Hz in one run). pulse-top and pulse-export keep the latest window, so a 5 s camera freeze showed as a 0.03 ms gap and thetopic_gapwarn was buried. The timer now re-phases instead of replaying: after a stall there is exactly one long window holding the full gap (5021 ms on the same repro), then normal cadence, and no window is ever shorter than half a period. Same fix on the receive side (a frozen subscriber process). The gap accounting itself was already right and is unchanged; the hot path is untouched. Regression testTimer.NoCatchUpBurstAfterStall.
Changed
- docs/ALTERNATIVES.md compares against NVIDIA’s
greenwave_monitor, the packaged subscriber-based monitor a Discourse reader said they were switching from; section plus a positioning-table row.
Added
-
pulse-top 0.4.0:
pulse-export, Prometheus / OTLP exporter and a Grafana example. A second entry point inros2-pulse-topthat tails the probe’s jsonl logs with pulse-top’s follower and parser and serves/metricsin the Prometheus text format on port 9464 from a stdlib HTTP server: per-topic publish and callback rate per path, largest gap,recv_lagdeficit, active warns, node up and last-seen age, per-process window period, age and timestamp, and window / warn / skipped-line counters, labelledpid(fromtopic_freq.<pid>.log),topic,node.--otlp URLpushes the same series as OTLP/HTTP JSON throughurllib(gauges, cumulative sums, UCUM units; checked against OpenTelemetry Collector 0.128.0). Absent keys stay absent series, never 0; a process that stops flushing loses its topic series after two periods and keeps a growing age. No new dependency.examples/grafana/holds a docker compose (exporter, Prometheus, Grafana) and a provisioned dashboard,--demoincluded; docs pagedocs/EXPORT.md.default_log_pathmoved fromapp.pytoreader.pyso the exporter does not import the TUI. 19 new pulse-top tests. -
pulse-top 0.3.0:
recv_lagwarn (issue #50). When a publisher’s process and a subscriber’s process are both probed, pulse-top pairs the topic’s publish rate (busier path) with its callback rate (inter + intra) and warns once the callbacks sit more than--lag-tol(default 10%) and more than two messages per window under the publish rate for--lag-windows(default 3) consecutive windows; it clears under half the tolerance and holds in between. A publish observation older than 1.5 periods cannot pair, so a dead or idle publisher (recv reads an explicit 0.0, KNOWN_ISSUES #12) is not lag; trackers are keyed by topic and source log, so a healthy subscriber process does not mask a lagging one, and a warn whose subscriber stopped flushing clears by time. Amber in the table (RECV cell), strip and Warns tab, with deficit, windows and source file in the sidebar; the text says the probe counts callbacks, not wire samples, so it cannot tell a drop from a backlog. Derived by the consumer: the probe, its output format, the spec grammar andpulse-checkare unchanged. Test node modeslow_listener <ms>andtest/integration/test_recv_lag.pyprove the two logs carry the gap and the model derives the warn from them; 21 new pulse-top tests. -
Blog post, “Watching a ROS 2 topic changes it”
(
docs/blog/2026-09-18-watching-a-ros2-topic-changes-it.md, on the docs site under Blog). The observer-effect bench written up for a systems-programming audience: what a subscriber costs (hz7 %,echo31 % of a core per watched 100 KB topic), whyhzon an intra-process topic switches serialization on in the watched process (+52 % CPU, 10/10 trials), howLD_PRELOADinterposition of theros_trace_*symbols counts in-process instead, and what that costs (+1.9 % ± 0.7 % paired). Every number cites its file and line in a trailing comment. Two figures underdocs/assets/blog/, regenerated from the committed CSV bybench/plot_observer_effect.py.site/build.pynow rewrites links relative to the page’s own directory (pages underblog/), and folds../in link targets, so a results page linking../../bench/RESULTS.mdlands on the benchmarks page instead of GitHub.
[0.5.0] - 2026-09-09
Adds an optional /statistics sidecar. The probe itself is unchanged.
Added
-
pulse_bridge(ros2 run ros2_pulse pulse_bridge): tails the probe’s jsonl log(s) and republishes every window on/statisticsasstatistics_msgs/MetricsMessage, in the shape rclcpp’s built-in topic statistics use (unitms,AVERAGE= message period,SAMPLE_COUNT,MAXIMUM= largest gap when measured), so existing consumers of that topic read pulse windows, intra-process included, with no integration work. Parameters:files,glob(default$TMPDIR/topic_freq.*.log, re-expanded every poll),topic,unit(ms|Hz),poll_period_s,source_name. Runs as its own process so the probe stays out of the DDS graph and free of rclcpp;package.xmlnow declaresrclcppandstatistics_msgsfor this executable only. Rate is measured at the subscription when the process has one, at the publisher otherwise; inter/intra report the busier path, never the sum. Text-format logs are refused with one warning per file. Asked for on ROS Discourse (topic 57637). -
core
metrics_mapperandline_follower: the window-to-sample mapping and the incremental line reader behind the bridge, ROS-free so both run in the standalone gtest lane
File truncated at 100 lines see the full file
Package Dependencies
| Deps | Name |
|---|---|
| ament_cmake | |
| ament_cmake_gtest | |
| ament_cmake_pytest | |
| rclpy | |
| std_msgs | |
| ros2run | |
| rclcpp | |
| statistics_msgs |
System Dependencies
| Name |
|---|
| lttng-tools |
Dependant Packages
Launch files
Messages
Services
Plugins
Recent questions tagged ros2_pulse at Robotics Stack Exchange
|
|
ros2_pulse package from ros2_pulse reporos2_pulse |
ROS Distro
|
Package Summary
| Version | 0.5.0 |
| License | Apache-2.0 |
| Build type | AMENT_CMAKE |
| Use | RECOMMENDED |
Repository Summary
| Checkout URI | https://github.com/TanayK07/ros2_pulse.git |
| VCS Type | git |
| VCS Version | main |
| Last Updated | 2026-10-02 |
| Dev Status | DEVELOPED |
| Released | RELEASED |
| Contributing |
Help Wanted (-)
Good First Issues (-) Pull Requests to Review (-) |
Package Description
Additional Links
Maintainers
- Tanay Kedia
Authors
ros2_pulse
The heartbeat of your ROS 2 graph. A low-overhead probe that measures per-topic message rate and active-node liveness for both inter-process and intra-process traffic, on stock ROS 2 binaries, with no rebuild, no privileges and no network traffic. The counting hot path costs under a nanosecond per message; the whole probe costs about 2 % of workload CPU on a harsh 4,900 msg/s stress and less on real graphs.
pulse-top --demo: the probe’s log, live. Sparklines per topic, intra-process rates, structured warnings with ages. Install: pip3 install ros2-pulse-top (details).
Forty seconds on what watching a topic costs and what the probe does instead. Watch the video (40 s, YouTube) or read the docs.
The long version, for systems programmers: Watching a ROS 2 topic changes it, the observer-effect measurement and the symbol-interposition trick that avoids it.
Why
The question in production is simple: is every topic flowing at the rate it should, and which nodes are alive? The existing tools each fall short of answering it.
-
ros2 topic hzandros2 topic echosubscribe to one topic at a time. Watching a single 100 KB topic costs 7 % of a core withhzand 31 % withecho, they cannot see intra-process messages at all, and pointinghzat an intra-process topic makes the publisher start serializing every message, which raised the watched process’s CPU by 52 % in our measurements. - Built-in topic statistics are
bypassed by intra-process comms on Humble-class
binaries, so composable nodes carrying point clouds lose all introspection. This is fixed on
rollingand newer by rclcpp#3130 (merged April 2026); there is no public Humble backport as of this writing. -
ros2_tracing/ LTTng is built for offline analysis: a session daemon plus post-processing of a CTF trace just to get a rate. On Humble it also needs ROS rebuilt with the lttng-ust backend (Jazzy and newer trace out of the box). - CARET (Tier IV) uses the same hook layer as this probe, LD_PRELOAD over tracetools, which is a useful independent validation of the mechanism. It is built for deep offline latency and chain analysis and needs LTTng, a forked rclcpp and Jupyter post-processing. Complementary, not always-on.
- eBPF uprobes need
CAP_SYS_ADMIN, debugfs and a kernel with BTF and uprobes, which is often a non-starter on Jetson and other embedded targets, and they pay a kernel trap per message.
ros2_pulse hooks the tracetools instrumentation layer that rclcpp already calls on every
publish and every callback, counts in-process with a lock-free hot path, and writes ready-to-read
Hz to a small rolling file.
What you get
# ts_ns=1782887153899445923 window_s=5.000
TOPIC /scan 20.000000                      # publish-side, inter-process
PUB   /points inter=0.000000 intra=30.000000   # publish-side incl. intra (Iron+)
RECV  /scan inter=20.000000 intra=0.000000 # receive-side, BOTH transports
RECV  /points inter=0.000000 intra=30.000000   # <- intra-process, invisible to other tools on Humble
JITTER /scan recv max_dt_ms=21.284             # largest inter-arrival gap (opt-in, see below)
NODE  /perception
NODE  /planner
WARN  TOPIC /scan hz=1.200000 expected=[18,22]  # only with an expected-rate spec (see below)
If a sidecar exporter or a log shipper is reading instead of a person, ROS_TOPIC_STATS_FORMAT=jsonl
writes every window as one JSON object per line with the same gates and values. See
JSON Lines output. Dashboards that already
read rclcpp’s built-in topic statistics get the same numbers on /statistics from the
pulse_bridge sidecar, and Prometheus, OTLP and
Grafana get them from pulse-export.
How it works
libros2_pulse.so is injected with LD_PRELOAD. It exports the same symbols as
libtracetools.so’s tracepoint API (ros_trace_rcl_publish, ros_trace_callback_start, the
init tracepoints and so on). The dynamic linker binds rclcpp’s calls to ours first; each
interposer records a stat and forwards to the real function through dlsym(RTLD_NEXT, ...).
rclcpp calls these functions unconditionally (the LTTng enable check is inside them), so the
probe works with no tracing session and adds no DDS traffic.
- Intra-process visibility comes from
callback_start(callback, is_intra_process), which fires for every subscription callback regardless of transport. - The hot path is a per-endpoint relaxed atomic increment behind a 256-slot thread-local cache with a stride-breaking hash. No global lock, no per-message string hashing. Counting costs about 0.3 ns/op on a fixed endpoint and 0.6 to 1.2 ns/op alternating across a working set on the reference box, two orders of magnitude under a single LTTng-UST tracepoint (about 158 ns).
- A background timer snapshots and resets the counts every
ROS_TOPIC_STATISTICS_PUBLISH_PERIODseconds and appends the rates toROS_TOPIC_STATS_OUTPUT_FILE.
The pure C++ core (core/) has no ROS dependency and is unit tested on its own; the probe layer
(probe/) is a thin LD_PRELOAD shim.
Install
apt
File truncated at 100 lines see the full file
Changelog
All notable changes to this project are documented here. Format follows Keep a Changelog; versions follow SemVer.
[Unreleased]
Fixed
-
pulse-top 0.4.1: pulse-top found no files on a default-format stack (issue #58). With the
probe in
.bashrcand noROS_TOPIC_STATS_FORMAT, every log is in the default text format. pulse-top parsed jsonl only, and it redrew the top bar only after a parsed window, so a directory of healthy text logs read “0 file(s)” forever even though the glob had matched them all. pulse-top and pulse-export now read the text format as well, sniffed per line like the C++log_reader, and a text window maps to the sameWindowits jsonl twin parses to (a line the probe did not print stays an absent field, never 0). The top bar is redrawn every tick, puts the file count before the path, and a notice line says why the table is empty: no file matches yet, N files found and waiting for the first window, or which files are not probe output. The follower now keeps blank lines, which close a text window, so no window arrives one period late. pulse-export’slines_skipped_totalcounts only lines that are in neither format. -
pulse-top 0.4.1:
--theme light|dark|terminalandPULSE_TOP_THEME(issue #59). The colours were hard-coded for a dark background, unreadable on the white terminals used outdoors.lightis black on white with warn colours picked to read on white (amber is brown, not yellow);terminalpaints nothing and uses the terminal’s own background and ANSI palette (Textual’sansi-darktheme);darkstays the default. The stylesheet now takes every colour from the Textual theme. The active tab’s label was invisible while the tab bar had focus (purple on purple) and is readable again. Textual floor raised to 8.2.7 for the ANSI theme. -
A publisher frozen by SIGSTOP read as a ~0 ms gap after it resumed. The flush timer
advanced its deadline one interval per fire, so when the whole probed process was frozen (the
flush thread with it) it replayed every missed tick back to back on SIGCONT: one window
carrying the stall, then a burst of ~0-length windows with a near-0
pub_max_dt_ms/recv_max_dt_msand nonsense Hz (50,000 Hz in one run). pulse-top and pulse-export keep the latest window, so a 5 s camera freeze showed as a 0.03 ms gap and thetopic_gapwarn was buried. The timer now re-phases instead of replaying: after a stall there is exactly one long window holding the full gap (5021 ms on the same repro), then normal cadence, and no window is ever shorter than half a period. Same fix on the receive side (a frozen subscriber process). The gap accounting itself was already right and is unchanged; the hot path is untouched. Regression testTimer.NoCatchUpBurstAfterStall.
Changed
- docs/ALTERNATIVES.md compares against NVIDIA’s
greenwave_monitor, the packaged subscriber-based monitor a Discourse reader said they were switching from; section plus a positioning-table row.
Added
-
pulse-top 0.4.0:
pulse-export, Prometheus / OTLP exporter and a Grafana example. A second entry point inros2-pulse-topthat tails the probe’s jsonl logs with pulse-top’s follower and parser and serves/metricsin the Prometheus text format on port 9464 from a stdlib HTTP server: per-topic publish and callback rate per path, largest gap,recv_lagdeficit, active warns, node up and last-seen age, per-process window period, age and timestamp, and window / warn / skipped-line counters, labelledpid(fromtopic_freq.<pid>.log),topic,node.--otlp URLpushes the same series as OTLP/HTTP JSON throughurllib(gauges, cumulative sums, UCUM units; checked against OpenTelemetry Collector 0.128.0). Absent keys stay absent series, never 0; a process that stops flushing loses its topic series after two periods and keeps a growing age. No new dependency.examples/grafana/holds a docker compose (exporter, Prometheus, Grafana) and a provisioned dashboard,--demoincluded; docs pagedocs/EXPORT.md.default_log_pathmoved fromapp.pytoreader.pyso the exporter does not import the TUI. 19 new pulse-top tests. -
pulse-top 0.3.0:
recv_lagwarn (issue #50). When a publisher’s process and a subscriber’s process are both probed, pulse-top pairs the topic’s publish rate (busier path) with its callback rate (inter + intra) and warns once the callbacks sit more than--lag-tol(default 10%) and more than two messages per window under the publish rate for--lag-windows(default 3) consecutive windows; it clears under half the tolerance and holds in between. A publish observation older than 1.5 periods cannot pair, so a dead or idle publisher (recv reads an explicit 0.0, KNOWN_ISSUES #12) is not lag; trackers are keyed by topic and source log, so a healthy subscriber process does not mask a lagging one, and a warn whose subscriber stopped flushing clears by time. Amber in the table (RECV cell), strip and Warns tab, with deficit, windows and source file in the sidebar; the text says the probe counts callbacks, not wire samples, so it cannot tell a drop from a backlog. Derived by the consumer: the probe, its output format, the spec grammar andpulse-checkare unchanged. Test node modeslow_listener <ms>andtest/integration/test_recv_lag.pyprove the two logs carry the gap and the model derives the warn from them; 21 new pulse-top tests. -
Blog post, “Watching a ROS 2 topic changes it”
(
docs/blog/2026-09-18-watching-a-ros2-topic-changes-it.md, on the docs site under Blog). The observer-effect bench written up for a systems-programming audience: what a subscriber costs (hz7 %,echo31 % of a core per watched 100 KB topic), whyhzon an intra-process topic switches serialization on in the watched process (+52 % CPU, 10/10 trials), howLD_PRELOADinterposition of theros_trace_*symbols counts in-process instead, and what that costs (+1.9 % ± 0.7 % paired). Every number cites its file and line in a trailing comment. Two figures underdocs/assets/blog/, regenerated from the committed CSV bybench/plot_observer_effect.py.site/build.pynow rewrites links relative to the page’s own directory (pages underblog/), and folds../in link targets, so a results page linking../../bench/RESULTS.mdlands on the benchmarks page instead of GitHub.
[0.5.0] - 2026-09-09
Adds an optional /statistics sidecar. The probe itself is unchanged.
Added
-
pulse_bridge(ros2 run ros2_pulse pulse_bridge): tails the probe’s jsonl log(s) and republishes every window on/statisticsasstatistics_msgs/MetricsMessage, in the shape rclcpp’s built-in topic statistics use (unitms,AVERAGE= message period,SAMPLE_COUNT,MAXIMUM= largest gap when measured), so existing consumers of that topic read pulse windows, intra-process included, with no integration work. Parameters:files,glob(default$TMPDIR/topic_freq.*.log, re-expanded every poll),topic,unit(ms|Hz),poll_period_s,source_name. Runs as its own process so the probe stays out of the DDS graph and free of rclcpp;package.xmlnow declaresrclcppandstatistics_msgsfor this executable only. Rate is measured at the subscription when the process has one, at the publisher otherwise; inter/intra report the busier path, never the sum. Text-format logs are refused with one warning per file. Asked for on ROS Discourse (topic 57637). -
core
metrics_mapperandline_follower: the window-to-sample mapping and the incremental line reader behind the bridge, ROS-free so both run in the standalone gtest lane
File truncated at 100 lines see the full file
Package Dependencies
| Deps | Name |
|---|---|
| ament_cmake | |
| ament_cmake_gtest | |
| ament_cmake_pytest | |
| rclpy | |
| std_msgs | |
| ros2run | |
| rclcpp | |
| statistics_msgs |
System Dependencies
| Name |
|---|
| lttng-tools |
Dependant Packages
Launch files
Messages
Services
Plugins
Recent questions tagged ros2_pulse at Robotics Stack Exchange
|
|
ros2_pulse package from ros2_pulse reporos2_pulse |
ROS Distro
|
Package Summary
| Version | 0.5.0 |
| License | Apache-2.0 |
| Build type | AMENT_CMAKE |
| Use | RECOMMENDED |
Repository Summary
| Checkout URI | https://github.com/TanayK07/ros2_pulse.git |
| VCS Type | git |
| VCS Version | main |
| Last Updated | 2026-10-02 |
| Dev Status | DEVELOPED |
| Released | RELEASED |
| Contributing |
Help Wanted (-)
Good First Issues (-) Pull Requests to Review (-) |
Package Description
Additional Links
Maintainers
- Tanay Kedia
Authors
ros2_pulse
The heartbeat of your ROS 2 graph. A low-overhead probe that measures per-topic message rate and active-node liveness for both inter-process and intra-process traffic, on stock ROS 2 binaries, with no rebuild, no privileges and no network traffic. The counting hot path costs under a nanosecond per message; the whole probe costs about 2 % of workload CPU on a harsh 4,900 msg/s stress and less on real graphs.
pulse-top --demo: the probe’s log, live. Sparklines per topic, intra-process rates, structured warnings with ages. Install: pip3 install ros2-pulse-top (details).
Forty seconds on what watching a topic costs and what the probe does instead. Watch the video (40 s, YouTube) or read the docs.
The long version, for systems programmers: Watching a ROS 2 topic changes it, the observer-effect measurement and the symbol-interposition trick that avoids it.
Why
The question in production is simple: is every topic flowing at the rate it should, and which nodes are alive? The existing tools each fall short of answering it.
-
ros2 topic hzandros2 topic echosubscribe to one topic at a time. Watching a single 100 KB topic costs 7 % of a core withhzand 31 % withecho, they cannot see intra-process messages at all, and pointinghzat an intra-process topic makes the publisher start serializing every message, which raised the watched process’s CPU by 52 % in our measurements. - Built-in topic statistics are
bypassed by intra-process comms on Humble-class
binaries, so composable nodes carrying point clouds lose all introspection. This is fixed on
rollingand newer by rclcpp#3130 (merged April 2026); there is no public Humble backport as of this writing. -
ros2_tracing/ LTTng is built for offline analysis: a session daemon plus post-processing of a CTF trace just to get a rate. On Humble it also needs ROS rebuilt with the lttng-ust backend (Jazzy and newer trace out of the box). - CARET (Tier IV) uses the same hook layer as this probe, LD_PRELOAD over tracetools, which is a useful independent validation of the mechanism. It is built for deep offline latency and chain analysis and needs LTTng, a forked rclcpp and Jupyter post-processing. Complementary, not always-on.
- eBPF uprobes need
CAP_SYS_ADMIN, debugfs and a kernel with BTF and uprobes, which is often a non-starter on Jetson and other embedded targets, and they pay a kernel trap per message.
ros2_pulse hooks the tracetools instrumentation layer that rclcpp already calls on every
publish and every callback, counts in-process with a lock-free hot path, and writes ready-to-read
Hz to a small rolling file.
What you get
# ts_ns=1782887153899445923 window_s=5.000
TOPIC /scan 20.000000                      # publish-side, inter-process
PUB   /points inter=0.000000 intra=30.000000   # publish-side incl. intra (Iron+)
RECV  /scan inter=20.000000 intra=0.000000 # receive-side, BOTH transports
RECV  /points inter=0.000000 intra=30.000000   # <- intra-process, invisible to other tools on Humble
JITTER /scan recv max_dt_ms=21.284             # largest inter-arrival gap (opt-in, see below)
NODE  /perception
NODE  /planner
WARN  TOPIC /scan hz=1.200000 expected=[18,22]  # only with an expected-rate spec (see below)
If a sidecar exporter or a log shipper is reading instead of a person, ROS_TOPIC_STATS_FORMAT=jsonl
writes every window as one JSON object per line with the same gates and values. See
JSON Lines output. Dashboards that already
read rclcpp’s built-in topic statistics get the same numbers on /statistics from the
pulse_bridge sidecar, and Prometheus, OTLP and
Grafana get them from pulse-export.
How it works
libros2_pulse.so is injected with LD_PRELOAD. It exports the same symbols as
libtracetools.so’s tracepoint API (ros_trace_rcl_publish, ros_trace_callback_start, the
init tracepoints and so on). The dynamic linker binds rclcpp’s calls to ours first; each
interposer records a stat and forwards to the real function through dlsym(RTLD_NEXT, ...).
rclcpp calls these functions unconditionally (the LTTng enable check is inside them), so the
probe works with no tracing session and adds no DDS traffic.
- Intra-process visibility comes from
callback_start(callback, is_intra_process), which fires for every subscription callback regardless of transport. - The hot path is a per-endpoint relaxed atomic increment behind a 256-slot thread-local cache with a stride-breaking hash. No global lock, no per-message string hashing. Counting costs about 0.3 ns/op on a fixed endpoint and 0.6 to 1.2 ns/op alternating across a working set on the reference box, two orders of magnitude under a single LTTng-UST tracepoint (about 158 ns).
- A background timer snapshots and resets the counts every
ROS_TOPIC_STATISTICS_PUBLISH_PERIODseconds and appends the rates toROS_TOPIC_STATS_OUTPUT_FILE.
The pure C++ core (core/) has no ROS dependency and is unit tested on its own; the probe layer
(probe/) is a thin LD_PRELOAD shim.
Install
apt
File truncated at 100 lines see the full file
Changelog
All notable changes to this project are documented here. Format follows Keep a Changelog; versions follow SemVer.
[Unreleased]
Fixed
-
pulse-top 0.4.1: pulse-top found no files on a default-format stack (issue #58). With the
probe in
.bashrcand noROS_TOPIC_STATS_FORMAT, every log is in the default text format. pulse-top parsed jsonl only, and it redrew the top bar only after a parsed window, so a directory of healthy text logs read “0 file(s)” forever even though the glob had matched them all. pulse-top and pulse-export now read the text format as well, sniffed per line like the C++log_reader, and a text window maps to the sameWindowits jsonl twin parses to (a line the probe did not print stays an absent field, never 0). The top bar is redrawn every tick, puts the file count before the path, and a notice line says why the table is empty: no file matches yet, N files found and waiting for the first window, or which files are not probe output. The follower now keeps blank lines, which close a text window, so no window arrives one period late. pulse-export’slines_skipped_totalcounts only lines that are in neither format. -
pulse-top 0.4.1:
--theme light|dark|terminalandPULSE_TOP_THEME(issue #59). The colours were hard-coded for a dark background, unreadable on the white terminals used outdoors.lightis black on white with warn colours picked to read on white (amber is brown, not yellow);terminalpaints nothing and uses the terminal’s own background and ANSI palette (Textual’sansi-darktheme);darkstays the default. The stylesheet now takes every colour from the Textual theme. The active tab’s label was invisible while the tab bar had focus (purple on purple) and is readable again. Textual floor raised to 8.2.7 for the ANSI theme. -
A publisher frozen by SIGSTOP read as a ~0 ms gap after it resumed. The flush timer
advanced its deadline one interval per fire, so when the whole probed process was frozen (the
flush thread with it) it replayed every missed tick back to back on SIGCONT: one window
carrying the stall, then a burst of ~0-length windows with a near-0
pub_max_dt_ms/recv_max_dt_msand nonsense Hz (50,000 Hz in one run). pulse-top and pulse-export keep the latest window, so a 5 s camera freeze showed as a 0.03 ms gap and thetopic_gapwarn was buried. The timer now re-phases instead of replaying: after a stall there is exactly one long window holding the full gap (5021 ms on the same repro), then normal cadence, and no window is ever shorter than half a period. Same fix on the receive side (a frozen subscriber process). The gap accounting itself was already right and is unchanged; the hot path is untouched. Regression testTimer.NoCatchUpBurstAfterStall.
Changed
- docs/ALTERNATIVES.md compares against NVIDIA’s
greenwave_monitor, the packaged subscriber-based monitor a Discourse reader said they were switching from; section plus a positioning-table row.
Added
-
pulse-top 0.4.0:
pulse-export, Prometheus / OTLP exporter and a Grafana example. A second entry point inros2-pulse-topthat tails the probe’s jsonl logs with pulse-top’s follower and parser and serves/metricsin the Prometheus text format on port 9464 from a stdlib HTTP server: per-topic publish and callback rate per path, largest gap,recv_lagdeficit, active warns, node up and last-seen age, per-process window period, age and timestamp, and window / warn / skipped-line counters, labelledpid(fromtopic_freq.<pid>.log),topic,node.--otlp URLpushes the same series as OTLP/HTTP JSON throughurllib(gauges, cumulative sums, UCUM units; checked against OpenTelemetry Collector 0.128.0). Absent keys stay absent series, never 0; a process that stops flushing loses its topic series after two periods and keeps a growing age. No new dependency.examples/grafana/holds a docker compose (exporter, Prometheus, Grafana) and a provisioned dashboard,--demoincluded; docs pagedocs/EXPORT.md.default_log_pathmoved fromapp.pytoreader.pyso the exporter does not import the TUI. 19 new pulse-top tests. -
pulse-top 0.3.0:
recv_lagwarn (issue #50). When a publisher’s process and a subscriber’s process are both probed, pulse-top pairs the topic’s publish rate (busier path) with its callback rate (inter + intra) and warns once the callbacks sit more than--lag-tol(default 10%) and more than two messages per window under the publish rate for--lag-windows(default 3) consecutive windows; it clears under half the tolerance and holds in between. A publish observation older than 1.5 periods cannot pair, so a dead or idle publisher (recv reads an explicit 0.0, KNOWN_ISSUES #12) is not lag; trackers are keyed by topic and source log, so a healthy subscriber process does not mask a lagging one, and a warn whose subscriber stopped flushing clears by time. Amber in the table (RECV cell), strip and Warns tab, with deficit, windows and source file in the sidebar; the text says the probe counts callbacks, not wire samples, so it cannot tell a drop from a backlog. Derived by the consumer: the probe, its output format, the spec grammar andpulse-checkare unchanged. Test node modeslow_listener <ms>andtest/integration/test_recv_lag.pyprove the two logs carry the gap and the model derives the warn from them; 21 new pulse-top tests. -
Blog post, “Watching a ROS 2 topic changes it”
(
docs/blog/2026-09-18-watching-a-ros2-topic-changes-it.md, on the docs site under Blog). The observer-effect bench written up for a systems-programming audience: what a subscriber costs (hz7 %,echo31 % of a core per watched 100 KB topic), whyhzon an intra-process topic switches serialization on in the watched process (+52 % CPU, 10/10 trials), howLD_PRELOADinterposition of theros_trace_*symbols counts in-process instead, and what that costs (+1.9 % ± 0.7 % paired). Every number cites its file and line in a trailing comment. Two figures underdocs/assets/blog/, regenerated from the committed CSV bybench/plot_observer_effect.py.site/build.pynow rewrites links relative to the page’s own directory (pages underblog/), and folds../in link targets, so a results page linking../../bench/RESULTS.mdlands on the benchmarks page instead of GitHub.
[0.5.0] - 2026-09-09
Adds an optional /statistics sidecar. The probe itself is unchanged.
Added
-
pulse_bridge(ros2 run ros2_pulse pulse_bridge): tails the probe’s jsonl log(s) and republishes every window on/statisticsasstatistics_msgs/MetricsMessage, in the shape rclcpp’s built-in topic statistics use (unitms,AVERAGE= message period,SAMPLE_COUNT,MAXIMUM= largest gap when measured), so existing consumers of that topic read pulse windows, intra-process included, with no integration work. Parameters:files,glob(default$TMPDIR/topic_freq.*.log, re-expanded every poll),topic,unit(ms|Hz),poll_period_s,source_name. Runs as its own process so the probe stays out of the DDS graph and free of rclcpp;package.xmlnow declaresrclcppandstatistics_msgsfor this executable only. Rate is measured at the subscription when the process has one, at the publisher otherwise; inter/intra report the busier path, never the sum. Text-format logs are refused with one warning per file. Asked for on ROS Discourse (topic 57637). -
core
metrics_mapperandline_follower: the window-to-sample mapping and the incremental line reader behind the bridge, ROS-free so both run in the standalone gtest lane
File truncated at 100 lines see the full file
Package Dependencies
| Deps | Name |
|---|---|
| ament_cmake | |
| ament_cmake_gtest | |
| ament_cmake_pytest | |
| rclpy | |
| std_msgs | |
| ros2run | |
| rclcpp | |
| statistics_msgs |
System Dependencies
| Name |
|---|
| lttng-tools |
Dependant Packages
Launch files
Messages
Services
Plugins
Recent questions tagged ros2_pulse at Robotics Stack Exchange
|
|
ros2_pulse package from ros2_pulse reporos2_pulse |
ROS Distro
|
Package Summary
| Version | 0.5.0 |
| License | Apache-2.0 |
| Build type | AMENT_CMAKE |
| Use | RECOMMENDED |
Repository Summary
| Checkout URI | https://github.com/TanayK07/ros2_pulse.git |
| VCS Type | git |
| VCS Version | main |
| Last Updated | 2026-10-02 |
| Dev Status | DEVELOPED |
| Released | RELEASED |
| Contributing |
Help Wanted (-)
Good First Issues (-) Pull Requests to Review (-) |
Package Description
Additional Links
Maintainers
- Tanay Kedia
Authors
ros2_pulse
The heartbeat of your ROS 2 graph. A low-overhead probe that measures per-topic message rate and active-node liveness for both inter-process and intra-process traffic, on stock ROS 2 binaries, with no rebuild, no privileges and no network traffic. The counting hot path costs under a nanosecond per message; the whole probe costs about 2 % of workload CPU on a harsh 4,900 msg/s stress and less on real graphs.
pulse-top --demo: the probe’s log, live. Sparklines per topic, intra-process rates, structured warnings with ages. Install: pip3 install ros2-pulse-top (details).
Forty seconds on what watching a topic costs and what the probe does instead. Watch the video (40 s, YouTube) or read the docs.
The long version, for systems programmers: Watching a ROS 2 topic changes it, the observer-effect measurement and the symbol-interposition trick that avoids it.
Why
The question in production is simple: is every topic flowing at the rate it should, and which nodes are alive? The existing tools each fall short of answering it.
-
ros2 topic hzandros2 topic echosubscribe to one topic at a time. Watching a single 100 KB topic costs 7 % of a core withhzand 31 % withecho, they cannot see intra-process messages at all, and pointinghzat an intra-process topic makes the publisher start serializing every message, which raised the watched process’s CPU by 52 % in our measurements. - Built-in topic statistics are
bypassed by intra-process comms on Humble-class
binaries, so composable nodes carrying point clouds lose all introspection. This is fixed on
rollingand newer by rclcpp#3130 (merged April 2026); there is no public Humble backport as of this writing. -
ros2_tracing/ LTTng is built for offline analysis: a session daemon plus post-processing of a CTF trace just to get a rate. On Humble it also needs ROS rebuilt with the lttng-ust backend (Jazzy and newer trace out of the box). - CARET (Tier IV) uses the same hook layer as this probe, LD_PRELOAD over tracetools, which is a useful independent validation of the mechanism. It is built for deep offline latency and chain analysis and needs LTTng, a forked rclcpp and Jupyter post-processing. Complementary, not always-on.
- eBPF uprobes need
CAP_SYS_ADMIN, debugfs and a kernel with BTF and uprobes, which is often a non-starter on Jetson and other embedded targets, and they pay a kernel trap per message.
ros2_pulse hooks the tracetools instrumentation layer that rclcpp already calls on every
publish and every callback, counts in-process with a lock-free hot path, and writes ready-to-read
Hz to a small rolling file.
What you get
# ts_ns=1782887153899445923 window_s=5.000
TOPIC /scan 20.000000                      # publish-side, inter-process
PUB   /points inter=0.000000 intra=30.000000   # publish-side incl. intra (Iron+)
RECV  /scan inter=20.000000 intra=0.000000 # receive-side, BOTH transports
RECV  /points inter=0.000000 intra=30.000000   # <- intra-process, invisible to other tools on Humble
JITTER /scan recv max_dt_ms=21.284             # largest inter-arrival gap (opt-in, see below)
NODE  /perception
NODE  /planner
WARN  TOPIC /scan hz=1.200000 expected=[18,22]  # only with an expected-rate spec (see below)
If a sidecar exporter or a log shipper is reading instead of a person, ROS_TOPIC_STATS_FORMAT=jsonl
writes every window as one JSON object per line with the same gates and values. See
JSON Lines output. Dashboards that already
read rclcpp’s built-in topic statistics get the same numbers on /statistics from the
pulse_bridge sidecar, and Prometheus, OTLP and
Grafana get them from pulse-export.
How it works
libros2_pulse.so is injected with LD_PRELOAD. It exports the same symbols as
libtracetools.so’s tracepoint API (ros_trace_rcl_publish, ros_trace_callback_start, the
init tracepoints and so on). The dynamic linker binds rclcpp’s calls to ours first; each
interposer records a stat and forwards to the real function through dlsym(RTLD_NEXT, ...).
rclcpp calls these functions unconditionally (the LTTng enable check is inside them), so the
probe works with no tracing session and adds no DDS traffic.
- Intra-process visibility comes from
callback_start(callback, is_intra_process), which fires for every subscription callback regardless of transport. - The hot path is a per-endpoint relaxed atomic increment behind a 256-slot thread-local cache with a stride-breaking hash. No global lock, no per-message string hashing. Counting costs about 0.3 ns/op on a fixed endpoint and 0.6 to 1.2 ns/op alternating across a working set on the reference box, two orders of magnitude under a single LTTng-UST tracepoint (about 158 ns).
- A background timer snapshots and resets the counts every
ROS_TOPIC_STATISTICS_PUBLISH_PERIODseconds and appends the rates toROS_TOPIC_STATS_OUTPUT_FILE.
The pure C++ core (core/) has no ROS dependency and is unit tested on its own; the probe layer
(probe/) is a thin LD_PRELOAD shim.
Install
apt
File truncated at 100 lines see the full file
Changelog
All notable changes to this project are documented here. Format follows Keep a Changelog; versions follow SemVer.
[Unreleased]
Fixed
-
pulse-top 0.4.1: pulse-top found no files on a default-format stack (issue #58). With the
probe in
.bashrcand noROS_TOPIC_STATS_FORMAT, every log is in the default text format. pulse-top parsed jsonl only, and it redrew the top bar only after a parsed window, so a directory of healthy text logs read “0 file(s)” forever even though the glob had matched them all. pulse-top and pulse-export now read the text format as well, sniffed per line like the C++log_reader, and a text window maps to the sameWindowits jsonl twin parses to (a line the probe did not print stays an absent field, never 0). The top bar is redrawn every tick, puts the file count before the path, and a notice line says why the table is empty: no file matches yet, N files found and waiting for the first window, or which files are not probe output. The follower now keeps blank lines, which close a text window, so no window arrives one period late. pulse-export’slines_skipped_totalcounts only lines that are in neither format. -
pulse-top 0.4.1:
--theme light|dark|terminalandPULSE_TOP_THEME(issue #59). The colours were hard-coded for a dark background, unreadable on the white terminals used outdoors.lightis black on white with warn colours picked to read on white (amber is brown, not yellow);terminalpaints nothing and uses the terminal’s own background and ANSI palette (Textual’sansi-darktheme);darkstays the default. The stylesheet now takes every colour from the Textual theme. The active tab’s label was invisible while the tab bar had focus (purple on purple) and is readable again. Textual floor raised to 8.2.7 for the ANSI theme. -
A publisher frozen by SIGSTOP read as a ~0 ms gap after it resumed. The flush timer
advanced its deadline one interval per fire, so when the whole probed process was frozen (the
flush thread with it) it replayed every missed tick back to back on SIGCONT: one window
carrying the stall, then a burst of ~0-length windows with a near-0
pub_max_dt_ms/recv_max_dt_msand nonsense Hz (50,000 Hz in one run). pulse-top and pulse-export keep the latest window, so a 5 s camera freeze showed as a 0.03 ms gap and thetopic_gapwarn was buried. The timer now re-phases instead of replaying: after a stall there is exactly one long window holding the full gap (5021 ms on the same repro), then normal cadence, and no window is ever shorter than half a period. Same fix on the receive side (a frozen subscriber process). The gap accounting itself was already right and is unchanged; the hot path is untouched. Regression testTimer.NoCatchUpBurstAfterStall.
Changed
- docs/ALTERNATIVES.md compares against NVIDIA’s
greenwave_monitor, the packaged subscriber-based monitor a Discourse reader said they were switching from; section plus a positioning-table row.
Added
-
pulse-top 0.4.0:
pulse-export, Prometheus / OTLP exporter and a Grafana example. A second entry point inros2-pulse-topthat tails the probe’s jsonl logs with pulse-top’s follower and parser and serves/metricsin the Prometheus text format on port 9464 from a stdlib HTTP server: per-topic publish and callback rate per path, largest gap,recv_lagdeficit, active warns, node up and last-seen age, per-process window period, age and timestamp, and window / warn / skipped-line counters, labelledpid(fromtopic_freq.<pid>.log),topic,node.--otlp URLpushes the same series as OTLP/HTTP JSON throughurllib(gauges, cumulative sums, UCUM units; checked against OpenTelemetry Collector 0.128.0). Absent keys stay absent series, never 0; a process that stops flushing loses its topic series after two periods and keeps a growing age. No new dependency.examples/grafana/holds a docker compose (exporter, Prometheus, Grafana) and a provisioned dashboard,--demoincluded; docs pagedocs/EXPORT.md.default_log_pathmoved fromapp.pytoreader.pyso the exporter does not import the TUI. 19 new pulse-top tests. -
pulse-top 0.3.0:
recv_lagwarn (issue #50). When a publisher’s process and a subscriber’s process are both probed, pulse-top pairs the topic’s publish rate (busier path) with its callback rate (inter + intra) and warns once the callbacks sit more than--lag-tol(default 10%) and more than two messages per window under the publish rate for--lag-windows(default 3) consecutive windows; it clears under half the tolerance and holds in between. A publish observation older than 1.5 periods cannot pair, so a dead or idle publisher (recv reads an explicit 0.0, KNOWN_ISSUES #12) is not lag; trackers are keyed by topic and source log, so a healthy subscriber process does not mask a lagging one, and a warn whose subscriber stopped flushing clears by time. Amber in the table (RECV cell), strip and Warns tab, with deficit, windows and source file in the sidebar; the text says the probe counts callbacks, not wire samples, so it cannot tell a drop from a backlog. Derived by the consumer: the probe, its output format, the spec grammar andpulse-checkare unchanged. Test node modeslow_listener <ms>andtest/integration/test_recv_lag.pyprove the two logs carry the gap and the model derives the warn from them; 21 new pulse-top tests. -
Blog post, “Watching a ROS 2 topic changes it”
(
docs/blog/2026-09-18-watching-a-ros2-topic-changes-it.md, on the docs site under Blog). The observer-effect bench written up for a systems-programming audience: what a subscriber costs (hz7 %,echo31 % of a core per watched 100 KB topic), whyhzon an intra-process topic switches serialization on in the watched process (+52 % CPU, 10/10 trials), howLD_PRELOADinterposition of theros_trace_*symbols counts in-process instead, and what that costs (+1.9 % ± 0.7 % paired). Every number cites its file and line in a trailing comment. Two figures underdocs/assets/blog/, regenerated from the committed CSV bybench/plot_observer_effect.py.site/build.pynow rewrites links relative to the page’s own directory (pages underblog/), and folds../in link targets, so a results page linking../../bench/RESULTS.mdlands on the benchmarks page instead of GitHub.
[0.5.0] - 2026-09-09
Adds an optional /statistics sidecar. The probe itself is unchanged.
Added
-
pulse_bridge(ros2 run ros2_pulse pulse_bridge): tails the probe’s jsonl log(s) and republishes every window on/statisticsasstatistics_msgs/MetricsMessage, in the shape rclcpp’s built-in topic statistics use (unitms,AVERAGE= message period,SAMPLE_COUNT,MAXIMUM= largest gap when measured), so existing consumers of that topic read pulse windows, intra-process included, with no integration work. Parameters:files,glob(default$TMPDIR/topic_freq.*.log, re-expanded every poll),topic,unit(ms|Hz),poll_period_s,source_name. Runs as its own process so the probe stays out of the DDS graph and free of rclcpp;package.xmlnow declaresrclcppandstatistics_msgsfor this executable only. Rate is measured at the subscription when the process has one, at the publisher otherwise; inter/intra report the busier path, never the sum. Text-format logs are refused with one warning per file. Asked for on ROS Discourse (topic 57637). -
core
metrics_mapperandline_follower: the window-to-sample mapping and the incremental line reader behind the bridge, ROS-free so both run in the standalone gtest lane
File truncated at 100 lines see the full file
Package Dependencies
| Deps | Name |
|---|---|
| ament_cmake | |
| ament_cmake_gtest | |
| ament_cmake_pytest | |
| rclpy | |
| std_msgs | |
| ros2run | |
| rclcpp | |
| statistics_msgs |
System Dependencies
| Name |
|---|
| lttng-tools |
Dependant Packages
Launch files
Messages
Services
Plugins
Recent questions tagged ros2_pulse at Robotics Stack Exchange
|
|
ros2_pulse package from ros2_pulse reporos2_pulse |
ROS Distro
|
Package Summary
| Version | 0.5.0 |
| License | Apache-2.0 |
| Build type | AMENT_CMAKE |
| Use | RECOMMENDED |
Repository Summary
| Checkout URI | https://github.com/TanayK07/ros2_pulse.git |
| VCS Type | git |
| VCS Version | main |
| Last Updated | 2026-10-02 |
| Dev Status | DEVELOPED |
| Released | RELEASED |
| Contributing |
Help Wanted (-)
Good First Issues (-) Pull Requests to Review (-) |
Package Description
Additional Links
Maintainers
- Tanay Kedia
Authors
ros2_pulse
The heartbeat of your ROS 2 graph. A low-overhead probe that measures per-topic message rate and active-node liveness for both inter-process and intra-process traffic, on stock ROS 2 binaries, with no rebuild, no privileges and no network traffic. The counting hot path costs under a nanosecond per message; the whole probe costs about 2 % of workload CPU on a harsh 4,900 msg/s stress and less on real graphs.
pulse-top --demo: the probe’s log, live. Sparklines per topic, intra-process rates, structured warnings with ages. Install: pip3 install ros2-pulse-top (details).
Forty seconds on what watching a topic costs and what the probe does instead. Watch the video (40 s, YouTube) or read the docs.
The long version, for systems programmers: Watching a ROS 2 topic changes it, the observer-effect measurement and the symbol-interposition trick that avoids it.
Why
The question in production is simple: is every topic flowing at the rate it should, and which nodes are alive? The existing tools each fall short of answering it.
-
ros2 topic hzandros2 topic echosubscribe to one topic at a time. Watching a single 100 KB topic costs 7 % of a core withhzand 31 % withecho, they cannot see intra-process messages at all, and pointinghzat an intra-process topic makes the publisher start serializing every message, which raised the watched process’s CPU by 52 % in our measurements. - Built-in topic statistics are
bypassed by intra-process comms on Humble-class
binaries, so composable nodes carrying point clouds lose all introspection. This is fixed on
rollingand newer by rclcpp#3130 (merged April 2026); there is no public Humble backport as of this writing. -
ros2_tracing/ LTTng is built for offline analysis: a session daemon plus post-processing of a CTF trace just to get a rate. On Humble it also needs ROS rebuilt with the lttng-ust backend (Jazzy and newer trace out of the box). - CARET (Tier IV) uses the same hook layer as this probe, LD_PRELOAD over tracetools, which is a useful independent validation of the mechanism. It is built for deep offline latency and chain analysis and needs LTTng, a forked rclcpp and Jupyter post-processing. Complementary, not always-on.
- eBPF uprobes need
CAP_SYS_ADMIN, debugfs and a kernel with BTF and uprobes, which is often a non-starter on Jetson and other embedded targets, and they pay a kernel trap per message.
ros2_pulse hooks the tracetools instrumentation layer that rclcpp already calls on every
publish and every callback, counts in-process with a lock-free hot path, and writes ready-to-read
Hz to a small rolling file.
What you get
# ts_ns=1782887153899445923 window_s=5.000
TOPIC /scan 20.000000                      # publish-side, inter-process
PUB   /points inter=0.000000 intra=30.000000   # publish-side incl. intra (Iron+)
RECV  /scan inter=20.000000 intra=0.000000 # receive-side, BOTH transports
RECV  /points inter=0.000000 intra=30.000000   # <- intra-process, invisible to other tools on Humble
JITTER /scan recv max_dt_ms=21.284             # largest inter-arrival gap (opt-in, see below)
NODE  /perception
NODE  /planner
WARN  TOPIC /scan hz=1.200000 expected=[18,22]  # only with an expected-rate spec (see below)
If a sidecar exporter or a log shipper is reading instead of a person, ROS_TOPIC_STATS_FORMAT=jsonl
writes every window as one JSON object per line with the same gates and values. See
JSON Lines output. Dashboards that already
read rclcpp’s built-in topic statistics get the same numbers on /statistics from the
pulse_bridge sidecar, and Prometheus, OTLP and
Grafana get them from pulse-export.
How it works
libros2_pulse.so is injected with LD_PRELOAD. It exports the same symbols as
libtracetools.so’s tracepoint API (ros_trace_rcl_publish, ros_trace_callback_start, the
init tracepoints and so on). The dynamic linker binds rclcpp’s calls to ours first; each
interposer records a stat and forwards to the real function through dlsym(RTLD_NEXT, ...).
rclcpp calls these functions unconditionally (the LTTng enable check is inside them), so the
probe works with no tracing session and adds no DDS traffic.
- Intra-process visibility comes from
callback_start(callback, is_intra_process), which fires for every subscription callback regardless of transport. - The hot path is a per-endpoint relaxed atomic increment behind a 256-slot thread-local cache with a stride-breaking hash. No global lock, no per-message string hashing. Counting costs about 0.3 ns/op on a fixed endpoint and 0.6 to 1.2 ns/op alternating across a working set on the reference box, two orders of magnitude under a single LTTng-UST tracepoint (about 158 ns).
- A background timer snapshots and resets the counts every
ROS_TOPIC_STATISTICS_PUBLISH_PERIODseconds and appends the rates toROS_TOPIC_STATS_OUTPUT_FILE.
The pure C++ core (core/) has no ROS dependency and is unit tested on its own; the probe layer
(probe/) is a thin LD_PRELOAD shim.
Install
apt
File truncated at 100 lines see the full file
Changelog
All notable changes to this project are documented here. Format follows Keep a Changelog; versions follow SemVer.
[Unreleased]
Fixed
-
pulse-top 0.4.1: pulse-top found no files on a default-format stack (issue #58). With the
probe in
.bashrcand noROS_TOPIC_STATS_FORMAT, every log is in the default text format. pulse-top parsed jsonl only, and it redrew the top bar only after a parsed window, so a directory of healthy text logs read “0 file(s)” forever even though the glob had matched them all. pulse-top and pulse-export now read the text format as well, sniffed per line like the C++log_reader, and a text window maps to the sameWindowits jsonl twin parses to (a line the probe did not print stays an absent field, never 0). The top bar is redrawn every tick, puts the file count before the path, and a notice line says why the table is empty: no file matches yet, N files found and waiting for the first window, or which files are not probe output. The follower now keeps blank lines, which close a text window, so no window arrives one period late. pulse-export’slines_skipped_totalcounts only lines that are in neither format. -
pulse-top 0.4.1:
--theme light|dark|terminalandPULSE_TOP_THEME(issue #59). The colours were hard-coded for a dark background, unreadable on the white terminals used outdoors.lightis black on white with warn colours picked to read on white (amber is brown, not yellow);terminalpaints nothing and uses the terminal’s own background and ANSI palette (Textual’sansi-darktheme);darkstays the default. The stylesheet now takes every colour from the Textual theme. The active tab’s label was invisible while the tab bar had focus (purple on purple) and is readable again. Textual floor raised to 8.2.7 for the ANSI theme. -
A publisher frozen by SIGSTOP read as a ~0 ms gap after it resumed. The flush timer
advanced its deadline one interval per fire, so when the whole probed process was frozen (the
flush thread with it) it replayed every missed tick back to back on SIGCONT: one window
carrying the stall, then a burst of ~0-length windows with a near-0
pub_max_dt_ms/recv_max_dt_msand nonsense Hz (50,000 Hz in one run). pulse-top and pulse-export keep the latest window, so a 5 s camera freeze showed as a 0.03 ms gap and thetopic_gapwarn was buried. The timer now re-phases instead of replaying: after a stall there is exactly one long window holding the full gap (5021 ms on the same repro), then normal cadence, and no window is ever shorter than half a period. Same fix on the receive side (a frozen subscriber process). The gap accounting itself was already right and is unchanged; the hot path is untouched. Regression testTimer.NoCatchUpBurstAfterStall.
Changed
- docs/ALTERNATIVES.md compares against NVIDIA’s
greenwave_monitor, the packaged subscriber-based monitor a Discourse reader said they were switching from; section plus a positioning-table row.
Added
-
pulse-top 0.4.0:
pulse-export, Prometheus / OTLP exporter and a Grafana example. A second entry point inros2-pulse-topthat tails the probe’s jsonl logs with pulse-top’s follower and parser and serves/metricsin the Prometheus text format on port 9464 from a stdlib HTTP server: per-topic publish and callback rate per path, largest gap,recv_lagdeficit, active warns, node up and last-seen age, per-process window period, age and timestamp, and window / warn / skipped-line counters, labelledpid(fromtopic_freq.<pid>.log),topic,node.--otlp URLpushes the same series as OTLP/HTTP JSON throughurllib(gauges, cumulative sums, UCUM units; checked against OpenTelemetry Collector 0.128.0). Absent keys stay absent series, never 0; a process that stops flushing loses its topic series after two periods and keeps a growing age. No new dependency.examples/grafana/holds a docker compose (exporter, Prometheus, Grafana) and a provisioned dashboard,--demoincluded; docs pagedocs/EXPORT.md.default_log_pathmoved fromapp.pytoreader.pyso the exporter does not import the TUI. 19 new pulse-top tests. -
pulse-top 0.3.0:
recv_lagwarn (issue #50). When a publisher’s process and a subscriber’s process are both probed, pulse-top pairs the topic’s publish rate (busier path) with its callback rate (inter + intra) and warns once the callbacks sit more than--lag-tol(default 10%) and more than two messages per window under the publish rate for--lag-windows(default 3) consecutive windows; it clears under half the tolerance and holds in between. A publish observation older than 1.5 periods cannot pair, so a dead or idle publisher (recv reads an explicit 0.0, KNOWN_ISSUES #12) is not lag; trackers are keyed by topic and source log, so a healthy subscriber process does not mask a lagging one, and a warn whose subscriber stopped flushing clears by time. Amber in the table (RECV cell), strip and Warns tab, with deficit, windows and source file in the sidebar; the text says the probe counts callbacks, not wire samples, so it cannot tell a drop from a backlog. Derived by the consumer: the probe, its output format, the spec grammar andpulse-checkare unchanged. Test node modeslow_listener <ms>andtest/integration/test_recv_lag.pyprove the two logs carry the gap and the model derives the warn from them; 21 new pulse-top tests. -
Blog post, “Watching a ROS 2 topic changes it”
(
docs/blog/2026-09-18-watching-a-ros2-topic-changes-it.md, on the docs site under Blog). The observer-effect bench written up for a systems-programming audience: what a subscriber costs (hz7 %,echo31 % of a core per watched 100 KB topic), whyhzon an intra-process topic switches serialization on in the watched process (+52 % CPU, 10/10 trials), howLD_PRELOADinterposition of theros_trace_*symbols counts in-process instead, and what that costs (+1.9 % ± 0.7 % paired). Every number cites its file and line in a trailing comment. Two figures underdocs/assets/blog/, regenerated from the committed CSV bybench/plot_observer_effect.py.site/build.pynow rewrites links relative to the page’s own directory (pages underblog/), and folds../in link targets, so a results page linking../../bench/RESULTS.mdlands on the benchmarks page instead of GitHub.
[0.5.0] - 2026-09-09
Adds an optional /statistics sidecar. The probe itself is unchanged.
Added
-
pulse_bridge(ros2 run ros2_pulse pulse_bridge): tails the probe’s jsonl log(s) and republishes every window on/statisticsasstatistics_msgs/MetricsMessage, in the shape rclcpp’s built-in topic statistics use (unitms,AVERAGE= message period,SAMPLE_COUNT,MAXIMUM= largest gap when measured), so existing consumers of that topic read pulse windows, intra-process included, with no integration work. Parameters:files,glob(default$TMPDIR/topic_freq.*.log, re-expanded every poll),topic,unit(ms|Hz),poll_period_s,source_name. Runs as its own process so the probe stays out of the DDS graph and free of rclcpp;package.xmlnow declaresrclcppandstatistics_msgsfor this executable only. Rate is measured at the subscription when the process has one, at the publisher otherwise; inter/intra report the busier path, never the sum. Text-format logs are refused with one warning per file. Asked for on ROS Discourse (topic 57637). -
core
metrics_mapperandline_follower: the window-to-sample mapping and the incremental line reader behind the bridge, ROS-free so both run in the standalone gtest lane
File truncated at 100 lines see the full file
Package Dependencies
| Deps | Name |
|---|---|
| ament_cmake | |
| ament_cmake_gtest | |
| ament_cmake_pytest | |
| rclpy | |
| std_msgs | |
| ros2run | |
| rclcpp | |
| statistics_msgs |
System Dependencies
| Name |
|---|
| lttng-tools |
Dependant Packages
Launch files
Messages
Services
Plugins
Recent questions tagged ros2_pulse at Robotics Stack Exchange
|
|
ros2_pulse package from ros2_pulse reporos2_pulse |
ROS Distro
|
Package Summary
| Version | 0.5.0 |
| License | Apache-2.0 |
| Build type | AMENT_CMAKE |
| Use | RECOMMENDED |
Repository Summary
| Checkout URI | https://github.com/TanayK07/ros2_pulse.git |
| VCS Type | git |
| VCS Version | main |
| Last Updated | 2026-10-02 |
| Dev Status | DEVELOPED |
| Released | RELEASED |
| Contributing |
Help Wanted (-)
Good First Issues (-) Pull Requests to Review (-) |
Package Description
Additional Links
Maintainers
- Tanay Kedia
Authors
ros2_pulse
The heartbeat of your ROS 2 graph. A low-overhead probe that measures per-topic message rate and active-node liveness for both inter-process and intra-process traffic, on stock ROS 2 binaries, with no rebuild, no privileges and no network traffic. The counting hot path costs under a nanosecond per message; the whole probe costs about 2 % of workload CPU on a harsh 4,900 msg/s stress and less on real graphs.
pulse-top --demo: the probe’s log, live. Sparklines per topic, intra-process rates, structured warnings with ages. Install: pip3 install ros2-pulse-top (details).
Forty seconds on what watching a topic costs and what the probe does instead. Watch the video (40 s, YouTube) or read the docs.
The long version, for systems programmers: Watching a ROS 2 topic changes it, the observer-effect measurement and the symbol-interposition trick that avoids it.
Why
The question in production is simple: is every topic flowing at the rate it should, and which nodes are alive? The existing tools each fall short of answering it.
-
ros2 topic hzandros2 topic echosubscribe to one topic at a time. Watching a single 100 KB topic costs 7 % of a core withhzand 31 % withecho, they cannot see intra-process messages at all, and pointinghzat an intra-process topic makes the publisher start serializing every message, which raised the watched process’s CPU by 52 % in our measurements. - Built-in topic statistics are
bypassed by intra-process comms on Humble-class
binaries, so composable nodes carrying point clouds lose all introspection. This is fixed on
rollingand newer by rclcpp#3130 (merged April 2026); there is no public Humble backport as of this writing. -
ros2_tracing/ LTTng is built for offline analysis: a session daemon plus post-processing of a CTF trace just to get a rate. On Humble it also needs ROS rebuilt with the lttng-ust backend (Jazzy and newer trace out of the box). - CARET (Tier IV) uses the same hook layer as this probe, LD_PRELOAD over tracetools, which is a useful independent validation of the mechanism. It is built for deep offline latency and chain analysis and needs LTTng, a forked rclcpp and Jupyter post-processing. Complementary, not always-on.
- eBPF uprobes need
CAP_SYS_ADMIN, debugfs and a kernel with BTF and uprobes, which is often a non-starter on Jetson and other embedded targets, and they pay a kernel trap per message.
ros2_pulse hooks the tracetools instrumentation layer that rclcpp already calls on every
publish and every callback, counts in-process with a lock-free hot path, and writes ready-to-read
Hz to a small rolling file.
What you get
# ts_ns=1782887153899445923 window_s=5.000
TOPIC /scan 20.000000                      # publish-side, inter-process
PUB   /points inter=0.000000 intra=30.000000   # publish-side incl. intra (Iron+)
RECV  /scan inter=20.000000 intra=0.000000 # receive-side, BOTH transports
RECV  /points inter=0.000000 intra=30.000000   # <- intra-process, invisible to other tools on Humble
JITTER /scan recv max_dt_ms=21.284             # largest inter-arrival gap (opt-in, see below)
NODE  /perception
NODE  /planner
WARN  TOPIC /scan hz=1.200000 expected=[18,22]  # only with an expected-rate spec (see below)
If a sidecar exporter or a log shipper is reading instead of a person, ROS_TOPIC_STATS_FORMAT=jsonl
writes every window as one JSON object per line with the same gates and values. See
JSON Lines output. Dashboards that already
read rclcpp’s built-in topic statistics get the same numbers on /statistics from the
pulse_bridge sidecar, and Prometheus, OTLP and
Grafana get them from pulse-export.
How it works
libros2_pulse.so is injected with LD_PRELOAD. It exports the same symbols as
libtracetools.so’s tracepoint API (ros_trace_rcl_publish, ros_trace_callback_start, the
init tracepoints and so on). The dynamic linker binds rclcpp’s calls to ours first; each
interposer records a stat and forwards to the real function through dlsym(RTLD_NEXT, ...).
rclcpp calls these functions unconditionally (the LTTng enable check is inside them), so the
probe works with no tracing session and adds no DDS traffic.
- Intra-process visibility comes from
callback_start(callback, is_intra_process), which fires for every subscription callback regardless of transport. - The hot path is a per-endpoint relaxed atomic increment behind a 256-slot thread-local cache with a stride-breaking hash. No global lock, no per-message string hashing. Counting costs about 0.3 ns/op on a fixed endpoint and 0.6 to 1.2 ns/op alternating across a working set on the reference box, two orders of magnitude under a single LTTng-UST tracepoint (about 158 ns).
- A background timer snapshots and resets the counts every
ROS_TOPIC_STATISTICS_PUBLISH_PERIODseconds and appends the rates toROS_TOPIC_STATS_OUTPUT_FILE.
The pure C++ core (core/) has no ROS dependency and is unit tested on its own; the probe layer
(probe/) is a thin LD_PRELOAD shim.
Install
apt
File truncated at 100 lines see the full file
Changelog
All notable changes to this project are documented here. Format follows Keep a Changelog; versions follow SemVer.
[Unreleased]
Fixed
-
pulse-top 0.4.1: pulse-top found no files on a default-format stack (issue #58). With the
probe in
.bashrcand noROS_TOPIC_STATS_FORMAT, every log is in the default text format. pulse-top parsed jsonl only, and it redrew the top bar only after a parsed window, so a directory of healthy text logs read “0 file(s)” forever even though the glob had matched them all. pulse-top and pulse-export now read the text format as well, sniffed per line like the C++log_reader, and a text window maps to the sameWindowits jsonl twin parses to (a line the probe did not print stays an absent field, never 0). The top bar is redrawn every tick, puts the file count before the path, and a notice line says why the table is empty: no file matches yet, N files found and waiting for the first window, or which files are not probe output. The follower now keeps blank lines, which close a text window, so no window arrives one period late. pulse-export’slines_skipped_totalcounts only lines that are in neither format. -
pulse-top 0.4.1:
--theme light|dark|terminalandPULSE_TOP_THEME(issue #59). The colours were hard-coded for a dark background, unreadable on the white terminals used outdoors.lightis black on white with warn colours picked to read on white (amber is brown, not yellow);terminalpaints nothing and uses the terminal’s own background and ANSI palette (Textual’sansi-darktheme);darkstays the default. The stylesheet now takes every colour from the Textual theme. The active tab’s label was invisible while the tab bar had focus (purple on purple) and is readable again. Textual floor raised to 8.2.7 for the ANSI theme. -
A publisher frozen by SIGSTOP read as a ~0 ms gap after it resumed. The flush timer
advanced its deadline one interval per fire, so when the whole probed process was frozen (the
flush thread with it) it replayed every missed tick back to back on SIGCONT: one window
carrying the stall, then a burst of ~0-length windows with a near-0
pub_max_dt_ms/recv_max_dt_msand nonsense Hz (50,000 Hz in one run). pulse-top and pulse-export keep the latest window, so a 5 s camera freeze showed as a 0.03 ms gap and thetopic_gapwarn was buried. The timer now re-phases instead of replaying: after a stall there is exactly one long window holding the full gap (5021 ms on the same repro), then normal cadence, and no window is ever shorter than half a period. Same fix on the receive side (a frozen subscriber process). The gap accounting itself was already right and is unchanged; the hot path is untouched. Regression testTimer.NoCatchUpBurstAfterStall.
Changed
- docs/ALTERNATIVES.md compares against NVIDIA’s
greenwave_monitor, the packaged subscriber-based monitor a Discourse reader said they were switching from; section plus a positioning-table row.
Added
-
pulse-top 0.4.0:
pulse-export, Prometheus / OTLP exporter and a Grafana example. A second entry point inros2-pulse-topthat tails the probe’s jsonl logs with pulse-top’s follower and parser and serves/metricsin the Prometheus text format on port 9464 from a stdlib HTTP server: per-topic publish and callback rate per path, largest gap,recv_lagdeficit, active warns, node up and last-seen age, per-process window period, age and timestamp, and window / warn / skipped-line counters, labelledpid(fromtopic_freq.<pid>.log),topic,node.--otlp URLpushes the same series as OTLP/HTTP JSON throughurllib(gauges, cumulative sums, UCUM units; checked against OpenTelemetry Collector 0.128.0). Absent keys stay absent series, never 0; a process that stops flushing loses its topic series after two periods and keeps a growing age. No new dependency.examples/grafana/holds a docker compose (exporter, Prometheus, Grafana) and a provisioned dashboard,--demoincluded; docs pagedocs/EXPORT.md.default_log_pathmoved fromapp.pytoreader.pyso the exporter does not import the TUI. 19 new pulse-top tests. -
pulse-top 0.3.0:
recv_lagwarn (issue #50). When a publisher’s process and a subscriber’s process are both probed, pulse-top pairs the topic’s publish rate (busier path) with its callback rate (inter + intra) and warns once the callbacks sit more than--lag-tol(default 10%) and more than two messages per window under the publish rate for--lag-windows(default 3) consecutive windows; it clears under half the tolerance and holds in between. A publish observation older than 1.5 periods cannot pair, so a dead or idle publisher (recv reads an explicit 0.0, KNOWN_ISSUES #12) is not lag; trackers are keyed by topic and source log, so a healthy subscriber process does not mask a lagging one, and a warn whose subscriber stopped flushing clears by time. Amber in the table (RECV cell), strip and Warns tab, with deficit, windows and source file in the sidebar; the text says the probe counts callbacks, not wire samples, so it cannot tell a drop from a backlog. Derived by the consumer: the probe, its output format, the spec grammar andpulse-checkare unchanged. Test node modeslow_listener <ms>andtest/integration/test_recv_lag.pyprove the two logs carry the gap and the model derives the warn from them; 21 new pulse-top tests. -
Blog post, “Watching a ROS 2 topic changes it”
(
docs/blog/2026-09-18-watching-a-ros2-topic-changes-it.md, on the docs site under Blog). The observer-effect bench written up for a systems-programming audience: what a subscriber costs (hz7 %,echo31 % of a core per watched 100 KB topic), whyhzon an intra-process topic switches serialization on in the watched process (+52 % CPU, 10/10 trials), howLD_PRELOADinterposition of theros_trace_*symbols counts in-process instead, and what that costs (+1.9 % ± 0.7 % paired). Every number cites its file and line in a trailing comment. Two figures underdocs/assets/blog/, regenerated from the committed CSV bybench/plot_observer_effect.py.site/build.pynow rewrites links relative to the page’s own directory (pages underblog/), and folds../in link targets, so a results page linking../../bench/RESULTS.mdlands on the benchmarks page instead of GitHub.
[0.5.0] - 2026-09-09
Adds an optional /statistics sidecar. The probe itself is unchanged.
Added
-
pulse_bridge(ros2 run ros2_pulse pulse_bridge): tails the probe’s jsonl log(s) and republishes every window on/statisticsasstatistics_msgs/MetricsMessage, in the shape rclcpp’s built-in topic statistics use (unitms,AVERAGE= message period,SAMPLE_COUNT,MAXIMUM= largest gap when measured), so existing consumers of that topic read pulse windows, intra-process included, with no integration work. Parameters:files,glob(default$TMPDIR/topic_freq.*.log, re-expanded every poll),topic,unit(ms|Hz),poll_period_s,source_name. Runs as its own process so the probe stays out of the DDS graph and free of rclcpp;package.xmlnow declaresrclcppandstatistics_msgsfor this executable only. Rate is measured at the subscription when the process has one, at the publisher otherwise; inter/intra report the busier path, never the sum. Text-format logs are refused with one warning per file. Asked for on ROS Discourse (topic 57637). -
core
metrics_mapperandline_follower: the window-to-sample mapping and the incremental line reader behind the bridge, ROS-free so both run in the standalone gtest lane
File truncated at 100 lines see the full file
Package Dependencies
| Deps | Name |
|---|---|
| ament_cmake | |
| ament_cmake_gtest | |
| ament_cmake_pytest | |
| rclpy | |
| std_msgs | |
| ros2run | |
| rclcpp | |
| statistics_msgs |
System Dependencies
| Name |
|---|
| lttng-tools |
Dependant Packages
Launch files
Messages
Services
Plugins
Recent questions tagged ros2_pulse at Robotics Stack Exchange
|
|
ros2_pulse package from ros2_pulse reporos2_pulse |
ROS Distro
|
Package Summary
| Version | 0.5.0 |
| License | Apache-2.0 |
| Build type | AMENT_CMAKE |
| Use | RECOMMENDED |
Repository Summary
| Checkout URI | https://github.com/TanayK07/ros2_pulse.git |
| VCS Type | git |
| VCS Version | main |
| Last Updated | 2026-10-02 |
| Dev Status | DEVELOPED |
| Released | RELEASED |
| Contributing |
Help Wanted (-)
Good First Issues (-) Pull Requests to Review (-) |
Package Description
Additional Links
Maintainers
- Tanay Kedia
Authors
ros2_pulse
The heartbeat of your ROS 2 graph. A low-overhead probe that measures per-topic message rate and active-node liveness for both inter-process and intra-process traffic, on stock ROS 2 binaries, with no rebuild, no privileges and no network traffic. The counting hot path costs under a nanosecond per message; the whole probe costs about 2 % of workload CPU on a harsh 4,900 msg/s stress and less on real graphs.
pulse-top --demo: the probe’s log, live. Sparklines per topic, intra-process rates, structured warnings with ages. Install: pip3 install ros2-pulse-top (details).
Forty seconds on what watching a topic costs and what the probe does instead. Watch the video (40 s, YouTube) or read the docs.
The long version, for systems programmers: Watching a ROS 2 topic changes it, the observer-effect measurement and the symbol-interposition trick that avoids it.
Why
The question in production is simple: is every topic flowing at the rate it should, and which nodes are alive? The existing tools each fall short of answering it.
-
ros2 topic hzandros2 topic echosubscribe to one topic at a time. Watching a single 100 KB topic costs 7 % of a core withhzand 31 % withecho, they cannot see intra-process messages at all, and pointinghzat an intra-process topic makes the publisher start serializing every message, which raised the watched process’s CPU by 52 % in our measurements. - Built-in topic statistics are
bypassed by intra-process comms on Humble-class
binaries, so composable nodes carrying point clouds lose all introspection. This is fixed on
rollingand newer by rclcpp#3130 (merged April 2026); there is no public Humble backport as of this writing. -
ros2_tracing/ LTTng is built for offline analysis: a session daemon plus post-processing of a CTF trace just to get a rate. On Humble it also needs ROS rebuilt with the lttng-ust backend (Jazzy and newer trace out of the box). - CARET (Tier IV) uses the same hook layer as this probe, LD_PRELOAD over tracetools, which is a useful independent validation of the mechanism. It is built for deep offline latency and chain analysis and needs LTTng, a forked rclcpp and Jupyter post-processing. Complementary, not always-on.
- eBPF uprobes need
CAP_SYS_ADMIN, debugfs and a kernel with BTF and uprobes, which is often a non-starter on Jetson and other embedded targets, and they pay a kernel trap per message.
ros2_pulse hooks the tracetools instrumentation layer that rclcpp already calls on every
publish and every callback, counts in-process with a lock-free hot path, and writes ready-to-read
Hz to a small rolling file.
What you get
# ts_ns=1782887153899445923 window_s=5.000
TOPIC /scan 20.000000                      # publish-side, inter-process
PUB   /points inter=0.000000 intra=30.000000   # publish-side incl. intra (Iron+)
RECV  /scan inter=20.000000 intra=0.000000 # receive-side, BOTH transports
RECV  /points inter=0.000000 intra=30.000000   # <- intra-process, invisible to other tools on Humble
JITTER /scan recv max_dt_ms=21.284             # largest inter-arrival gap (opt-in, see below)
NODE  /perception
NODE  /planner
WARN  TOPIC /scan hz=1.200000 expected=[18,22]  # only with an expected-rate spec (see below)
If a sidecar exporter or a log shipper is reading instead of a person, ROS_TOPIC_STATS_FORMAT=jsonl
writes every window as one JSON object per line with the same gates and values. See
JSON Lines output. Dashboards that already
read rclcpp’s built-in topic statistics get the same numbers on /statistics from the
pulse_bridge sidecar, and Prometheus, OTLP and
Grafana get them from pulse-export.
How it works
libros2_pulse.so is injected with LD_PRELOAD. It exports the same symbols as
libtracetools.so’s tracepoint API (ros_trace_rcl_publish, ros_trace_callback_start, the
init tracepoints and so on). The dynamic linker binds rclcpp’s calls to ours first; each
interposer records a stat and forwards to the real function through dlsym(RTLD_NEXT, ...).
rclcpp calls these functions unconditionally (the LTTng enable check is inside them), so the
probe works with no tracing session and adds no DDS traffic.
- Intra-process visibility comes from
callback_start(callback, is_intra_process), which fires for every subscription callback regardless of transport. - The hot path is a per-endpoint relaxed atomic increment behind a 256-slot thread-local cache with a stride-breaking hash. No global lock, no per-message string hashing. Counting costs about 0.3 ns/op on a fixed endpoint and 0.6 to 1.2 ns/op alternating across a working set on the reference box, two orders of magnitude under a single LTTng-UST tracepoint (about 158 ns).
- A background timer snapshots and resets the counts every
ROS_TOPIC_STATISTICS_PUBLISH_PERIODseconds and appends the rates toROS_TOPIC_STATS_OUTPUT_FILE.
The pure C++ core (core/) has no ROS dependency and is unit tested on its own; the probe layer
(probe/) is a thin LD_PRELOAD shim.
Install
apt
File truncated at 100 lines see the full file
Changelog
All notable changes to this project are documented here. Format follows Keep a Changelog; versions follow SemVer.
[Unreleased]
Fixed
-
pulse-top 0.4.1: pulse-top found no files on a default-format stack (issue #58). With the
probe in
.bashrcand noROS_TOPIC_STATS_FORMAT, every log is in the default text format. pulse-top parsed jsonl only, and it redrew the top bar only after a parsed window, so a directory of healthy text logs read “0 file(s)” forever even though the glob had matched them all. pulse-top and pulse-export now read the text format as well, sniffed per line like the C++log_reader, and a text window maps to the sameWindowits jsonl twin parses to (a line the probe did not print stays an absent field, never 0). The top bar is redrawn every tick, puts the file count before the path, and a notice line says why the table is empty: no file matches yet, N files found and waiting for the first window, or which files are not probe output. The follower now keeps blank lines, which close a text window, so no window arrives one period late. pulse-export’slines_skipped_totalcounts only lines that are in neither format. -
pulse-top 0.4.1:
--theme light|dark|terminalandPULSE_TOP_THEME(issue #59). The colours were hard-coded for a dark background, unreadable on the white terminals used outdoors.lightis black on white with warn colours picked to read on white (amber is brown, not yellow);terminalpaints nothing and uses the terminal’s own background and ANSI palette (Textual’sansi-darktheme);darkstays the default. The stylesheet now takes every colour from the Textual theme. The active tab’s label was invisible while the tab bar had focus (purple on purple) and is readable again. Textual floor raised to 8.2.7 for the ANSI theme. -
A publisher frozen by SIGSTOP read as a ~0 ms gap after it resumed. The flush timer
advanced its deadline one interval per fire, so when the whole probed process was frozen (the
flush thread with it) it replayed every missed tick back to back on SIGCONT: one window
carrying the stall, then a burst of ~0-length windows with a near-0
pub_max_dt_ms/recv_max_dt_msand nonsense Hz (50,000 Hz in one run). pulse-top and pulse-export keep the latest window, so a 5 s camera freeze showed as a 0.03 ms gap and thetopic_gapwarn was buried. The timer now re-phases instead of replaying: after a stall there is exactly one long window holding the full gap (5021 ms on the same repro), then normal cadence, and no window is ever shorter than half a period. Same fix on the receive side (a frozen subscriber process). The gap accounting itself was already right and is unchanged; the hot path is untouched. Regression testTimer.NoCatchUpBurstAfterStall.
Changed
- docs/ALTERNATIVES.md compares against NVIDIA’s
greenwave_monitor, the packaged subscriber-based monitor a Discourse reader said they were switching from; section plus a positioning-table row.
Added
-
pulse-top 0.4.0:
pulse-export, Prometheus / OTLP exporter and a Grafana example. A second entry point inros2-pulse-topthat tails the probe’s jsonl logs with pulse-top’s follower and parser and serves/metricsin the Prometheus text format on port 9464 from a stdlib HTTP server: per-topic publish and callback rate per path, largest gap,recv_lagdeficit, active warns, node up and last-seen age, per-process window period, age and timestamp, and window / warn / skipped-line counters, labelledpid(fromtopic_freq.<pid>.log),topic,node.--otlp URLpushes the same series as OTLP/HTTP JSON throughurllib(gauges, cumulative sums, UCUM units; checked against OpenTelemetry Collector 0.128.0). Absent keys stay absent series, never 0; a process that stops flushing loses its topic series after two periods and keeps a growing age. No new dependency.examples/grafana/holds a docker compose (exporter, Prometheus, Grafana) and a provisioned dashboard,--demoincluded; docs pagedocs/EXPORT.md.default_log_pathmoved fromapp.pytoreader.pyso the exporter does not import the TUI. 19 new pulse-top tests. -
pulse-top 0.3.0:
recv_lagwarn (issue #50). When a publisher’s process and a subscriber’s process are both probed, pulse-top pairs the topic’s publish rate (busier path) with its callback rate (inter + intra) and warns once the callbacks sit more than--lag-tol(default 10%) and more than two messages per window under the publish rate for--lag-windows(default 3) consecutive windows; it clears under half the tolerance and holds in between. A publish observation older than 1.5 periods cannot pair, so a dead or idle publisher (recv reads an explicit 0.0, KNOWN_ISSUES #12) is not lag; trackers are keyed by topic and source log, so a healthy subscriber process does not mask a lagging one, and a warn whose subscriber stopped flushing clears by time. Amber in the table (RECV cell), strip and Warns tab, with deficit, windows and source file in the sidebar; the text says the probe counts callbacks, not wire samples, so it cannot tell a drop from a backlog. Derived by the consumer: the probe, its output format, the spec grammar andpulse-checkare unchanged. Test node modeslow_listener <ms>andtest/integration/test_recv_lag.pyprove the two logs carry the gap and the model derives the warn from them; 21 new pulse-top tests. -
Blog post, “Watching a ROS 2 topic changes it”
(
docs/blog/2026-09-18-watching-a-ros2-topic-changes-it.md, on the docs site under Blog). The observer-effect bench written up for a systems-programming audience: what a subscriber costs (hz7 %,echo31 % of a core per watched 100 KB topic), whyhzon an intra-process topic switches serialization on in the watched process (+52 % CPU, 10/10 trials), howLD_PRELOADinterposition of theros_trace_*symbols counts in-process instead, and what that costs (+1.9 % ± 0.7 % paired). Every number cites its file and line in a trailing comment. Two figures underdocs/assets/blog/, regenerated from the committed CSV bybench/plot_observer_effect.py.site/build.pynow rewrites links relative to the page’s own directory (pages underblog/), and folds../in link targets, so a results page linking../../bench/RESULTS.mdlands on the benchmarks page instead of GitHub.
[0.5.0] - 2026-09-09
Adds an optional /statistics sidecar. The probe itself is unchanged.
Added
-
pulse_bridge(ros2 run ros2_pulse pulse_bridge): tails the probe’s jsonl log(s) and republishes every window on/statisticsasstatistics_msgs/MetricsMessage, in the shape rclcpp’s built-in topic statistics use (unitms,AVERAGE= message period,SAMPLE_COUNT,MAXIMUM= largest gap when measured), so existing consumers of that topic read pulse windows, intra-process included, with no integration work. Parameters:files,glob(default$TMPDIR/topic_freq.*.log, re-expanded every poll),topic,unit(ms|Hz),poll_period_s,source_name. Runs as its own process so the probe stays out of the DDS graph and free of rclcpp;package.xmlnow declaresrclcppandstatistics_msgsfor this executable only. Rate is measured at the subscription when the process has one, at the publisher otherwise; inter/intra report the busier path, never the sum. Text-format logs are refused with one warning per file. Asked for on ROS Discourse (topic 57637). -
core
metrics_mapperandline_follower: the window-to-sample mapping and the incremental line reader behind the bridge, ROS-free so both run in the standalone gtest lane
File truncated at 100 lines see the full file
Package Dependencies
| Deps | Name |
|---|---|
| ament_cmake | |
| ament_cmake_gtest | |
| ament_cmake_pytest | |
| rclpy | |
| std_msgs | |
| ros2run | |
| rclcpp | |
| statistics_msgs |
System Dependencies
| Name |
|---|
| lttng-tools |
Dependant Packages
Launch files
Messages
Services
Plugins
Recent questions tagged ros2_pulse at Robotics Stack Exchange
|
|
ros2_pulse package from ros2_pulse reporos2_pulse |
ROS Distro
|
Package Summary
| Version | 0.5.0 |
| License | Apache-2.0 |
| Build type | AMENT_CMAKE |
| Use | RECOMMENDED |
Repository Summary
| Checkout URI | https://github.com/TanayK07/ros2_pulse.git |
| VCS Type | git |
| VCS Version | main |
| Last Updated | 2026-10-02 |
| Dev Status | DEVELOPED |
| Released | RELEASED |
| Contributing |
Help Wanted (-)
Good First Issues (-) Pull Requests to Review (-) |
Package Description
Additional Links
Maintainers
- Tanay Kedia
Authors
ros2_pulse
The heartbeat of your ROS 2 graph. A low-overhead probe that measures per-topic message rate and active-node liveness for both inter-process and intra-process traffic, on stock ROS 2 binaries, with no rebuild, no privileges and no network traffic. The counting hot path costs under a nanosecond per message; the whole probe costs about 2 % of workload CPU on a harsh 4,900 msg/s stress and less on real graphs.
pulse-top --demo: the probe’s log, live. Sparklines per topic, intra-process rates, structured warnings with ages. Install: pip3 install ros2-pulse-top (details).
Forty seconds on what watching a topic costs and what the probe does instead. Watch the video (40 s, YouTube) or read the docs.
The long version, for systems programmers: Watching a ROS 2 topic changes it, the observer-effect measurement and the symbol-interposition trick that avoids it.
Why
The question in production is simple: is every topic flowing at the rate it should, and which nodes are alive? The existing tools each fall short of answering it.
-
ros2 topic hzandros2 topic echosubscribe to one topic at a time. Watching a single 100 KB topic costs 7 % of a core withhzand 31 % withecho, they cannot see intra-process messages at all, and pointinghzat an intra-process topic makes the publisher start serializing every message, which raised the watched process’s CPU by 52 % in our measurements. - Built-in topic statistics are
bypassed by intra-process comms on Humble-class
binaries, so composable nodes carrying point clouds lose all introspection. This is fixed on
rollingand newer by rclcpp#3130 (merged April 2026); there is no public Humble backport as of this writing. -
ros2_tracing/ LTTng is built for offline analysis: a session daemon plus post-processing of a CTF trace just to get a rate. On Humble it also needs ROS rebuilt with the lttng-ust backend (Jazzy and newer trace out of the box). - CARET (Tier IV) uses the same hook layer as this probe, LD_PRELOAD over tracetools, which is a useful independent validation of the mechanism. It is built for deep offline latency and chain analysis and needs LTTng, a forked rclcpp and Jupyter post-processing. Complementary, not always-on.
- eBPF uprobes need
CAP_SYS_ADMIN, debugfs and a kernel with BTF and uprobes, which is often a non-starter on Jetson and other embedded targets, and they pay a kernel trap per message.
ros2_pulse hooks the tracetools instrumentation layer that rclcpp already calls on every
publish and every callback, counts in-process with a lock-free hot path, and writes ready-to-read
Hz to a small rolling file.
What you get
# ts_ns=1782887153899445923 window_s=5.000
TOPIC /scan 20.000000                      # publish-side, inter-process
PUB   /points inter=0.000000 intra=30.000000   # publish-side incl. intra (Iron+)
RECV  /scan inter=20.000000 intra=0.000000 # receive-side, BOTH transports
RECV  /points inter=0.000000 intra=30.000000   # <- intra-process, invisible to other tools on Humble
JITTER /scan recv max_dt_ms=21.284             # largest inter-arrival gap (opt-in, see below)
NODE  /perception
NODE  /planner
WARN  TOPIC /scan hz=1.200000 expected=[18,22]  # only with an expected-rate spec (see below)
If a sidecar exporter or a log shipper is reading instead of a person, ROS_TOPIC_STATS_FORMAT=jsonl
writes every window as one JSON object per line with the same gates and values. See
JSON Lines output. Dashboards that already
read rclcpp’s built-in topic statistics get the same numbers on /statistics from the
pulse_bridge sidecar, and Prometheus, OTLP and
Grafana get them from pulse-export.
How it works
libros2_pulse.so is injected with LD_PRELOAD. It exports the same symbols as
libtracetools.so’s tracepoint API (ros_trace_rcl_publish, ros_trace_callback_start, the
init tracepoints and so on). The dynamic linker binds rclcpp’s calls to ours first; each
interposer records a stat and forwards to the real function through dlsym(RTLD_NEXT, ...).
rclcpp calls these functions unconditionally (the LTTng enable check is inside them), so the
probe works with no tracing session and adds no DDS traffic.
- Intra-process visibility comes from
callback_start(callback, is_intra_process), which fires for every subscription callback regardless of transport. - The hot path is a per-endpoint relaxed atomic increment behind a 256-slot thread-local cache with a stride-breaking hash. No global lock, no per-message string hashing. Counting costs about 0.3 ns/op on a fixed endpoint and 0.6 to 1.2 ns/op alternating across a working set on the reference box, two orders of magnitude under a single LTTng-UST tracepoint (about 158 ns).
- A background timer snapshots and resets the counts every
ROS_TOPIC_STATISTICS_PUBLISH_PERIODseconds and appends the rates toROS_TOPIC_STATS_OUTPUT_FILE.
The pure C++ core (core/) has no ROS dependency and is unit tested on its own; the probe layer
(probe/) is a thin LD_PRELOAD shim.
Install
apt
File truncated at 100 lines see the full file
Changelog
All notable changes to this project are documented here. Format follows Keep a Changelog; versions follow SemVer.
[Unreleased]
Fixed
-
pulse-top 0.4.1: pulse-top found no files on a default-format stack (issue #58). With the
probe in
.bashrcand noROS_TOPIC_STATS_FORMAT, every log is in the default text format. pulse-top parsed jsonl only, and it redrew the top bar only after a parsed window, so a directory of healthy text logs read “0 file(s)” forever even though the glob had matched them all. pulse-top and pulse-export now read the text format as well, sniffed per line like the C++log_reader, and a text window maps to the sameWindowits jsonl twin parses to (a line the probe did not print stays an absent field, never 0). The top bar is redrawn every tick, puts the file count before the path, and a notice line says why the table is empty: no file matches yet, N files found and waiting for the first window, or which files are not probe output. The follower now keeps blank lines, which close a text window, so no window arrives one period late. pulse-export’slines_skipped_totalcounts only lines that are in neither format. -
pulse-top 0.4.1:
--theme light|dark|terminalandPULSE_TOP_THEME(issue #59). The colours were hard-coded for a dark background, unreadable on the white terminals used outdoors.lightis black on white with warn colours picked to read on white (amber is brown, not yellow);terminalpaints nothing and uses the terminal’s own background and ANSI palette (Textual’sansi-darktheme);darkstays the default. The stylesheet now takes every colour from the Textual theme. The active tab’s label was invisible while the tab bar had focus (purple on purple) and is readable again. Textual floor raised to 8.2.7 for the ANSI theme. -
A publisher frozen by SIGSTOP read as a ~0 ms gap after it resumed. The flush timer
advanced its deadline one interval per fire, so when the whole probed process was frozen (the
flush thread with it) it replayed every missed tick back to back on SIGCONT: one window
carrying the stall, then a burst of ~0-length windows with a near-0
pub_max_dt_ms/recv_max_dt_msand nonsense Hz (50,000 Hz in one run). pulse-top and pulse-export keep the latest window, so a 5 s camera freeze showed as a 0.03 ms gap and thetopic_gapwarn was buried. The timer now re-phases instead of replaying: after a stall there is exactly one long window holding the full gap (5021 ms on the same repro), then normal cadence, and no window is ever shorter than half a period. Same fix on the receive side (a frozen subscriber process). The gap accounting itself was already right and is unchanged; the hot path is untouched. Regression testTimer.NoCatchUpBurstAfterStall.
Changed
- docs/ALTERNATIVES.md compares against NVIDIA’s
greenwave_monitor, the packaged subscriber-based monitor a Discourse reader said they were switching from; section plus a positioning-table row.
Added
-
pulse-top 0.4.0:
pulse-export, Prometheus / OTLP exporter and a Grafana example. A second entry point inros2-pulse-topthat tails the probe’s jsonl logs with pulse-top’s follower and parser and serves/metricsin the Prometheus text format on port 9464 from a stdlib HTTP server: per-topic publish and callback rate per path, largest gap,recv_lagdeficit, active warns, node up and last-seen age, per-process window period, age and timestamp, and window / warn / skipped-line counters, labelledpid(fromtopic_freq.<pid>.log),topic,node.--otlp URLpushes the same series as OTLP/HTTP JSON throughurllib(gauges, cumulative sums, UCUM units; checked against OpenTelemetry Collector 0.128.0). Absent keys stay absent series, never 0; a process that stops flushing loses its topic series after two periods and keeps a growing age. No new dependency.examples/grafana/holds a docker compose (exporter, Prometheus, Grafana) and a provisioned dashboard,--demoincluded; docs pagedocs/EXPORT.md.default_log_pathmoved fromapp.pytoreader.pyso the exporter does not import the TUI. 19 new pulse-top tests. -
pulse-top 0.3.0:
recv_lagwarn (issue #50). When a publisher’s process and a subscriber’s process are both probed, pulse-top pairs the topic’s publish rate (busier path) with its callback rate (inter + intra) and warns once the callbacks sit more than--lag-tol(default 10%) and more than two messages per window under the publish rate for--lag-windows(default 3) consecutive windows; it clears under half the tolerance and holds in between. A publish observation older than 1.5 periods cannot pair, so a dead or idle publisher (recv reads an explicit 0.0, KNOWN_ISSUES #12) is not lag; trackers are keyed by topic and source log, so a healthy subscriber process does not mask a lagging one, and a warn whose subscriber stopped flushing clears by time. Amber in the table (RECV cell), strip and Warns tab, with deficit, windows and source file in the sidebar; the text says the probe counts callbacks, not wire samples, so it cannot tell a drop from a backlog. Derived by the consumer: the probe, its output format, the spec grammar andpulse-checkare unchanged. Test node modeslow_listener <ms>andtest/integration/test_recv_lag.pyprove the two logs carry the gap and the model derives the warn from them; 21 new pulse-top tests. -
Blog post, “Watching a ROS 2 topic changes it”
(
docs/blog/2026-09-18-watching-a-ros2-topic-changes-it.md, on the docs site under Blog). The observer-effect bench written up for a systems-programming audience: what a subscriber costs (hz7 %,echo31 % of a core per watched 100 KB topic), whyhzon an intra-process topic switches serialization on in the watched process (+52 % CPU, 10/10 trials), howLD_PRELOADinterposition of theros_trace_*symbols counts in-process instead, and what that costs (+1.9 % ± 0.7 % paired). Every number cites its file and line in a trailing comment. Two figures underdocs/assets/blog/, regenerated from the committed CSV bybench/plot_observer_effect.py.site/build.pynow rewrites links relative to the page’s own directory (pages underblog/), and folds../in link targets, so a results page linking../../bench/RESULTS.mdlands on the benchmarks page instead of GitHub.
[0.5.0] - 2026-09-09
Adds an optional /statistics sidecar. The probe itself is unchanged.
Added
-
pulse_bridge(ros2 run ros2_pulse pulse_bridge): tails the probe’s jsonl log(s) and republishes every window on/statisticsasstatistics_msgs/MetricsMessage, in the shape rclcpp’s built-in topic statistics use (unitms,AVERAGE= message period,SAMPLE_COUNT,MAXIMUM= largest gap when measured), so existing consumers of that topic read pulse windows, intra-process included, with no integration work. Parameters:files,glob(default$TMPDIR/topic_freq.*.log, re-expanded every poll),topic,unit(ms|Hz),poll_period_s,source_name. Runs as its own process so the probe stays out of the DDS graph and free of rclcpp;package.xmlnow declaresrclcppandstatistics_msgsfor this executable only. Rate is measured at the subscription when the process has one, at the publisher otherwise; inter/intra report the busier path, never the sum. Text-format logs are refused with one warning per file. Asked for on ROS Discourse (topic 57637). -
core
metrics_mapperandline_follower: the window-to-sample mapping and the incremental line reader behind the bridge, ROS-free so both run in the standalone gtest lane
File truncated at 100 lines see the full file
Package Dependencies
| Deps | Name |
|---|---|
| ament_cmake | |
| ament_cmake_gtest | |
| ament_cmake_pytest | |
| rclpy | |
| std_msgs | |
| ros2run | |
| rclcpp | |
| statistics_msgs |
System Dependencies
| Name |
|---|
| lttng-tools |
Dependant Packages
Launch files
Messages
Services
Plugins
Recent questions tagged ros2_pulse at Robotics Stack Exchange
|
|
ros2_pulse package from ros2_pulse reporos2_pulse |
ROS Distro
|
Package Summary
| Version | 0.5.0 |
| License | Apache-2.0 |
| Build type | AMENT_CMAKE |
| Use | RECOMMENDED |
Repository Summary
| Checkout URI | https://github.com/TanayK07/ros2_pulse.git |
| VCS Type | git |
| VCS Version | main |
| Last Updated | 2026-10-02 |
| Dev Status | DEVELOPED |
| Released | RELEASED |
| Contributing |
Help Wanted (-)
Good First Issues (-) Pull Requests to Review (-) |
Package Description
Additional Links
Maintainers
- Tanay Kedia
Authors
ros2_pulse
The heartbeat of your ROS 2 graph. A low-overhead probe that measures per-topic message rate and active-node liveness for both inter-process and intra-process traffic, on stock ROS 2 binaries, with no rebuild, no privileges and no network traffic. The counting hot path costs under a nanosecond per message; the whole probe costs about 2 % of workload CPU on a harsh 4,900 msg/s stress and less on real graphs.
pulse-top --demo: the probe’s log, live. Sparklines per topic, intra-process rates, structured warnings with ages. Install: pip3 install ros2-pulse-top (details).
Forty seconds on what watching a topic costs and what the probe does instead. Watch the video (40 s, YouTube) or read the docs.
The long version, for systems programmers: Watching a ROS 2 topic changes it, the observer-effect measurement and the symbol-interposition trick that avoids it.
Why
The question in production is simple: is every topic flowing at the rate it should, and which nodes are alive? The existing tools each fall short of answering it.
-
ros2 topic hzandros2 topic echosubscribe to one topic at a time. Watching a single 100 KB topic costs 7 % of a core withhzand 31 % withecho, they cannot see intra-process messages at all, and pointinghzat an intra-process topic makes the publisher start serializing every message, which raised the watched process’s CPU by 52 % in our measurements. - Built-in topic statistics are
bypassed by intra-process comms on Humble-class
binaries, so composable nodes carrying point clouds lose all introspection. This is fixed on
rollingand newer by rclcpp#3130 (merged April 2026); there is no public Humble backport as of this writing. -
ros2_tracing/ LTTng is built for offline analysis: a session daemon plus post-processing of a CTF trace just to get a rate. On Humble it also needs ROS rebuilt with the lttng-ust backend (Jazzy and newer trace out of the box). - CARET (Tier IV) uses the same hook layer as this probe, LD_PRELOAD over tracetools, which is a useful independent validation of the mechanism. It is built for deep offline latency and chain analysis and needs LTTng, a forked rclcpp and Jupyter post-processing. Complementary, not always-on.
- eBPF uprobes need
CAP_SYS_ADMIN, debugfs and a kernel with BTF and uprobes, which is often a non-starter on Jetson and other embedded targets, and they pay a kernel trap per message.
ros2_pulse hooks the tracetools instrumentation layer that rclcpp already calls on every
publish and every callback, counts in-process with a lock-free hot path, and writes ready-to-read
Hz to a small rolling file.
What you get
# ts_ns=1782887153899445923 window_s=5.000
TOPIC /scan 20.000000                      # publish-side, inter-process
PUB   /points inter=0.000000 intra=30.000000   # publish-side incl. intra (Iron+)
RECV  /scan inter=20.000000 intra=0.000000 # receive-side, BOTH transports
RECV  /points inter=0.000000 intra=30.000000   # <- intra-process, invisible to other tools on Humble
JITTER /scan recv max_dt_ms=21.284             # largest inter-arrival gap (opt-in, see below)
NODE  /perception
NODE  /planner
WARN  TOPIC /scan hz=1.200000 expected=[18,22]  # only with an expected-rate spec (see below)
If a sidecar exporter or a log shipper is reading instead of a person, ROS_TOPIC_STATS_FORMAT=jsonl
writes every window as one JSON object per line with the same gates and values. See
JSON Lines output. Dashboards that already
read rclcpp’s built-in topic statistics get the same numbers on /statistics from the
pulse_bridge sidecar, and Prometheus, OTLP and
Grafana get them from pulse-export.
How it works
libros2_pulse.so is injected with LD_PRELOAD. It exports the same symbols as
libtracetools.so’s tracepoint API (ros_trace_rcl_publish, ros_trace_callback_start, the
init tracepoints and so on). The dynamic linker binds rclcpp’s calls to ours first; each
interposer records a stat and forwards to the real function through dlsym(RTLD_NEXT, ...).
rclcpp calls these functions unconditionally (the LTTng enable check is inside them), so the
probe works with no tracing session and adds no DDS traffic.
- Intra-process visibility comes from
callback_start(callback, is_intra_process), which fires for every subscription callback regardless of transport. - The hot path is a per-endpoint relaxed atomic increment behind a 256-slot thread-local cache with a stride-breaking hash. No global lock, no per-message string hashing. Counting costs about 0.3 ns/op on a fixed endpoint and 0.6 to 1.2 ns/op alternating across a working set on the reference box, two orders of magnitude under a single LTTng-UST tracepoint (about 158 ns).
- A background timer snapshots and resets the counts every
ROS_TOPIC_STATISTICS_PUBLISH_PERIODseconds and appends the rates toROS_TOPIC_STATS_OUTPUT_FILE.
The pure C++ core (core/) has no ROS dependency and is unit tested on its own; the probe layer
(probe/) is a thin LD_PRELOAD shim.
Install
apt
File truncated at 100 lines see the full file
Changelog
All notable changes to this project are documented here. Format follows Keep a Changelog; versions follow SemVer.
[Unreleased]
Fixed
-
pulse-top 0.4.1: pulse-top found no files on a default-format stack (issue #58). With the
probe in
.bashrcand noROS_TOPIC_STATS_FORMAT, every log is in the default text format. pulse-top parsed jsonl only, and it redrew the top bar only after a parsed window, so a directory of healthy text logs read “0 file(s)” forever even though the glob had matched them all. pulse-top and pulse-export now read the text format as well, sniffed per line like the C++log_reader, and a text window maps to the sameWindowits jsonl twin parses to (a line the probe did not print stays an absent field, never 0). The top bar is redrawn every tick, puts the file count before the path, and a notice line says why the table is empty: no file matches yet, N files found and waiting for the first window, or which files are not probe output. The follower now keeps blank lines, which close a text window, so no window arrives one period late. pulse-export’slines_skipped_totalcounts only lines that are in neither format. -
pulse-top 0.4.1:
--theme light|dark|terminalandPULSE_TOP_THEME(issue #59). The colours were hard-coded for a dark background, unreadable on the white terminals used outdoors.lightis black on white with warn colours picked to read on white (amber is brown, not yellow);terminalpaints nothing and uses the terminal’s own background and ANSI palette (Textual’sansi-darktheme);darkstays the default. The stylesheet now takes every colour from the Textual theme. The active tab’s label was invisible while the tab bar had focus (purple on purple) and is readable again. Textual floor raised to 8.2.7 for the ANSI theme. -
A publisher frozen by SIGSTOP read as a ~0 ms gap after it resumed. The flush timer
advanced its deadline one interval per fire, so when the whole probed process was frozen (the
flush thread with it) it replayed every missed tick back to back on SIGCONT: one window
carrying the stall, then a burst of ~0-length windows with a near-0
pub_max_dt_ms/recv_max_dt_msand nonsense Hz (50,000 Hz in one run). pulse-top and pulse-export keep the latest window, so a 5 s camera freeze showed as a 0.03 ms gap and thetopic_gapwarn was buried. The timer now re-phases instead of replaying: after a stall there is exactly one long window holding the full gap (5021 ms on the same repro), then normal cadence, and no window is ever shorter than half a period. Same fix on the receive side (a frozen subscriber process). The gap accounting itself was already right and is unchanged; the hot path is untouched. Regression testTimer.NoCatchUpBurstAfterStall.
Changed
- docs/ALTERNATIVES.md compares against NVIDIA’s
greenwave_monitor, the packaged subscriber-based monitor a Discourse reader said they were switching from; section plus a positioning-table row.
Added
-
pulse-top 0.4.0:
pulse-export, Prometheus / OTLP exporter and a Grafana example. A second entry point inros2-pulse-topthat tails the probe’s jsonl logs with pulse-top’s follower and parser and serves/metricsin the Prometheus text format on port 9464 from a stdlib HTTP server: per-topic publish and callback rate per path, largest gap,recv_lagdeficit, active warns, node up and last-seen age, per-process window period, age and timestamp, and window / warn / skipped-line counters, labelledpid(fromtopic_freq.<pid>.log),topic,node.--otlp URLpushes the same series as OTLP/HTTP JSON throughurllib(gauges, cumulative sums, UCUM units; checked against OpenTelemetry Collector 0.128.0). Absent keys stay absent series, never 0; a process that stops flushing loses its topic series after two periods and keeps a growing age. No new dependency.examples/grafana/holds a docker compose (exporter, Prometheus, Grafana) and a provisioned dashboard,--demoincluded; docs pagedocs/EXPORT.md.default_log_pathmoved fromapp.pytoreader.pyso the exporter does not import the TUI. 19 new pulse-top tests. -
pulse-top 0.3.0:
recv_lagwarn (issue #50). When a publisher’s process and a subscriber’s process are both probed, pulse-top pairs the topic’s publish rate (busier path) with its callback rate (inter + intra) and warns once the callbacks sit more than--lag-tol(default 10%) and more than two messages per window under the publish rate for--lag-windows(default 3) consecutive windows; it clears under half the tolerance and holds in between. A publish observation older than 1.5 periods cannot pair, so a dead or idle publisher (recv reads an explicit 0.0, KNOWN_ISSUES #12) is not lag; trackers are keyed by topic and source log, so a healthy subscriber process does not mask a lagging one, and a warn whose subscriber stopped flushing clears by time. Amber in the table (RECV cell), strip and Warns tab, with deficit, windows and source file in the sidebar; the text says the probe counts callbacks, not wire samples, so it cannot tell a drop from a backlog. Derived by the consumer: the probe, its output format, the spec grammar andpulse-checkare unchanged. Test node modeslow_listener <ms>andtest/integration/test_recv_lag.pyprove the two logs carry the gap and the model derives the warn from them; 21 new pulse-top tests. -
Blog post, “Watching a ROS 2 topic changes it”
(
docs/blog/2026-09-18-watching-a-ros2-topic-changes-it.md, on the docs site under Blog). The observer-effect bench written up for a systems-programming audience: what a subscriber costs (hz7 %,echo31 % of a core per watched 100 KB topic), whyhzon an intra-process topic switches serialization on in the watched process (+52 % CPU, 10/10 trials), howLD_PRELOADinterposition of theros_trace_*symbols counts in-process instead, and what that costs (+1.9 % ± 0.7 % paired). Every number cites its file and line in a trailing comment. Two figures underdocs/assets/blog/, regenerated from the committed CSV bybench/plot_observer_effect.py.site/build.pynow rewrites links relative to the page’s own directory (pages underblog/), and folds../in link targets, so a results page linking../../bench/RESULTS.mdlands on the benchmarks page instead of GitHub.
[0.5.0] - 2026-09-09
Adds an optional /statistics sidecar. The probe itself is unchanged.
Added
-
pulse_bridge(ros2 run ros2_pulse pulse_bridge): tails the probe’s jsonl log(s) and republishes every window on/statisticsasstatistics_msgs/MetricsMessage, in the shape rclcpp’s built-in topic statistics use (unitms,AVERAGE= message period,SAMPLE_COUNT,MAXIMUM= largest gap when measured), so existing consumers of that topic read pulse windows, intra-process included, with no integration work. Parameters:files,glob(default$TMPDIR/topic_freq.*.log, re-expanded every poll),topic,unit(ms|Hz),poll_period_s,source_name. Runs as its own process so the probe stays out of the DDS graph and free of rclcpp;package.xmlnow declaresrclcppandstatistics_msgsfor this executable only. Rate is measured at the subscription when the process has one, at the publisher otherwise; inter/intra report the busier path, never the sum. Text-format logs are refused with one warning per file. Asked for on ROS Discourse (topic 57637). -
core
metrics_mapperandline_follower: the window-to-sample mapping and the incremental line reader behind the bridge, ROS-free so both run in the standalone gtest lane
File truncated at 100 lines see the full file
Package Dependencies
| Deps | Name |
|---|---|
| ament_cmake | |
| ament_cmake_gtest | |
| ament_cmake_pytest | |
| rclpy | |
| std_msgs | |
| ros2run | |
| rclcpp | |
| statistics_msgs |
System Dependencies
| Name |
|---|
| lttng-tools |
Dependant Packages
Launch files
Messages
Services
Plugins
Recent questions tagged ros2_pulse at Robotics Stack Exchange
|
|
ros2_pulse package from ros2_pulse reporos2_pulse |
ROS Distro
|
Package Summary
| Version | 0.5.0 |
| License | Apache-2.0 |
| Build type | AMENT_CMAKE |
| Use | RECOMMENDED |
Repository Summary
| Checkout URI | https://github.com/TanayK07/ros2_pulse.git |
| VCS Type | git |
| VCS Version | main |
| Last Updated | 2026-10-02 |
| Dev Status | DEVELOPED |
| Released | RELEASED |
| Contributing |
Help Wanted (-)
Good First Issues (-) Pull Requests to Review (-) |
Package Description
Additional Links
Maintainers
- Tanay Kedia
Authors
ros2_pulse
The heartbeat of your ROS 2 graph. A low-overhead probe that measures per-topic message rate and active-node liveness for both inter-process and intra-process traffic, on stock ROS 2 binaries, with no rebuild, no privileges and no network traffic. The counting hot path costs under a nanosecond per message; the whole probe costs about 2 % of workload CPU on a harsh 4,900 msg/s stress and less on real graphs.
pulse-top --demo: the probe’s log, live. Sparklines per topic, intra-process rates, structured warnings with ages. Install: pip3 install ros2-pulse-top (details).
Forty seconds on what watching a topic costs and what the probe does instead. Watch the video (40 s, YouTube) or read the docs.
The long version, for systems programmers: Watching a ROS 2 topic changes it, the observer-effect measurement and the symbol-interposition trick that avoids it.
Why
The question in production is simple: is every topic flowing at the rate it should, and which nodes are alive? The existing tools each fall short of answering it.
-
ros2 topic hzandros2 topic echosubscribe to one topic at a time. Watching a single 100 KB topic costs 7 % of a core withhzand 31 % withecho, they cannot see intra-process messages at all, and pointinghzat an intra-process topic makes the publisher start serializing every message, which raised the watched process’s CPU by 52 % in our measurements. - Built-in topic statistics are
bypassed by intra-process comms on Humble-class
binaries, so composable nodes carrying point clouds lose all introspection. This is fixed on
rollingand newer by rclcpp#3130 (merged April 2026); there is no public Humble backport as of this writing. -
ros2_tracing/ LTTng is built for offline analysis: a session daemon plus post-processing of a CTF trace just to get a rate. On Humble it also needs ROS rebuilt with the lttng-ust backend (Jazzy and newer trace out of the box). - CARET (Tier IV) uses the same hook layer as this probe, LD_PRELOAD over tracetools, which is a useful independent validation of the mechanism. It is built for deep offline latency and chain analysis and needs LTTng, a forked rclcpp and Jupyter post-processing. Complementary, not always-on.
- eBPF uprobes need
CAP_SYS_ADMIN, debugfs and a kernel with BTF and uprobes, which is often a non-starter on Jetson and other embedded targets, and they pay a kernel trap per message.
ros2_pulse hooks the tracetools instrumentation layer that rclcpp already calls on every
publish and every callback, counts in-process with a lock-free hot path, and writes ready-to-read
Hz to a small rolling file.
What you get
# ts_ns=1782887153899445923 window_s=5.000
TOPIC /scan 20.000000                      # publish-side, inter-process
PUB   /points inter=0.000000 intra=30.000000   # publish-side incl. intra (Iron+)
RECV  /scan inter=20.000000 intra=0.000000 # receive-side, BOTH transports
RECV  /points inter=0.000000 intra=30.000000   # <- intra-process, invisible to other tools on Humble
JITTER /scan recv max_dt_ms=21.284             # largest inter-arrival gap (opt-in, see below)
NODE  /perception
NODE  /planner
WARN  TOPIC /scan hz=1.200000 expected=[18,22]  # only with an expected-rate spec (see below)
If a sidecar exporter or a log shipper is reading instead of a person, ROS_TOPIC_STATS_FORMAT=jsonl
writes every window as one JSON object per line with the same gates and values. See
JSON Lines output. Dashboards that already
read rclcpp’s built-in topic statistics get the same numbers on /statistics from the
pulse_bridge sidecar, and Prometheus, OTLP and
Grafana get them from pulse-export.
How it works
libros2_pulse.so is injected with LD_PRELOAD. It exports the same symbols as
libtracetools.so’s tracepoint API (ros_trace_rcl_publish, ros_trace_callback_start, the
init tracepoints and so on). The dynamic linker binds rclcpp’s calls to ours first; each
interposer records a stat and forwards to the real function through dlsym(RTLD_NEXT, ...).
rclcpp calls these functions unconditionally (the LTTng enable check is inside them), so the
probe works with no tracing session and adds no DDS traffic.
- Intra-process visibility comes from
callback_start(callback, is_intra_process), which fires for every subscription callback regardless of transport. - The hot path is a per-endpoint relaxed atomic increment behind a 256-slot thread-local cache with a stride-breaking hash. No global lock, no per-message string hashing. Counting costs about 0.3 ns/op on a fixed endpoint and 0.6 to 1.2 ns/op alternating across a working set on the reference box, two orders of magnitude under a single LTTng-UST tracepoint (about 158 ns).
- A background timer snapshots and resets the counts every
ROS_TOPIC_STATISTICS_PUBLISH_PERIODseconds and appends the rates toROS_TOPIC_STATS_OUTPUT_FILE.
The pure C++ core (core/) has no ROS dependency and is unit tested on its own; the probe layer
(probe/) is a thin LD_PRELOAD shim.
Install
apt
File truncated at 100 lines see the full file
Changelog
All notable changes to this project are documented here. Format follows Keep a Changelog; versions follow SemVer.
[Unreleased]
Fixed
-
pulse-top 0.4.1: pulse-top found no files on a default-format stack (issue #58). With the
probe in
.bashrcand noROS_TOPIC_STATS_FORMAT, every log is in the default text format. pulse-top parsed jsonl only, and it redrew the top bar only after a parsed window, so a directory of healthy text logs read “0 file(s)” forever even though the glob had matched them all. pulse-top and pulse-export now read the text format as well, sniffed per line like the C++log_reader, and a text window maps to the sameWindowits jsonl twin parses to (a line the probe did not print stays an absent field, never 0). The top bar is redrawn every tick, puts the file count before the path, and a notice line says why the table is empty: no file matches yet, N files found and waiting for the first window, or which files are not probe output. The follower now keeps blank lines, which close a text window, so no window arrives one period late. pulse-export’slines_skipped_totalcounts only lines that are in neither format. -
pulse-top 0.4.1:
--theme light|dark|terminalandPULSE_TOP_THEME(issue #59). The colours were hard-coded for a dark background, unreadable on the white terminals used outdoors.lightis black on white with warn colours picked to read on white (amber is brown, not yellow);terminalpaints nothing and uses the terminal’s own background and ANSI palette (Textual’sansi-darktheme);darkstays the default. The stylesheet now takes every colour from the Textual theme. The active tab’s label was invisible while the tab bar had focus (purple on purple) and is readable again. Textual floor raised to 8.2.7 for the ANSI theme. -
A publisher frozen by SIGSTOP read as a ~0 ms gap after it resumed. The flush timer
advanced its deadline one interval per fire, so when the whole probed process was frozen (the
flush thread with it) it replayed every missed tick back to back on SIGCONT: one window
carrying the stall, then a burst of ~0-length windows with a near-0
pub_max_dt_ms/recv_max_dt_msand nonsense Hz (50,000 Hz in one run). pulse-top and pulse-export keep the latest window, so a 5 s camera freeze showed as a 0.03 ms gap and thetopic_gapwarn was buried. The timer now re-phases instead of replaying: after a stall there is exactly one long window holding the full gap (5021 ms on the same repro), then normal cadence, and no window is ever shorter than half a period. Same fix on the receive side (a frozen subscriber process). The gap accounting itself was already right and is unchanged; the hot path is untouched. Regression testTimer.NoCatchUpBurstAfterStall.
Changed
- docs/ALTERNATIVES.md compares against NVIDIA’s
greenwave_monitor, the packaged subscriber-based monitor a Discourse reader said they were switching from; section plus a positioning-table row.
Added
-
pulse-top 0.4.0:
pulse-export, Prometheus / OTLP exporter and a Grafana example. A second entry point inros2-pulse-topthat tails the probe’s jsonl logs with pulse-top’s follower and parser and serves/metricsin the Prometheus text format on port 9464 from a stdlib HTTP server: per-topic publish and callback rate per path, largest gap,recv_lagdeficit, active warns, node up and last-seen age, per-process window period, age and timestamp, and window / warn / skipped-line counters, labelledpid(fromtopic_freq.<pid>.log),topic,node.--otlp URLpushes the same series as OTLP/HTTP JSON throughurllib(gauges, cumulative sums, UCUM units; checked against OpenTelemetry Collector 0.128.0). Absent keys stay absent series, never 0; a process that stops flushing loses its topic series after two periods and keeps a growing age. No new dependency.examples/grafana/holds a docker compose (exporter, Prometheus, Grafana) and a provisioned dashboard,--demoincluded; docs pagedocs/EXPORT.md.default_log_pathmoved fromapp.pytoreader.pyso the exporter does not import the TUI. 19 new pulse-top tests. -
pulse-top 0.3.0:
recv_lagwarn (issue #50). When a publisher’s process and a subscriber’s process are both probed, pulse-top pairs the topic’s publish rate (busier path) with its callback rate (inter + intra) and warns once the callbacks sit more than--lag-tol(default 10%) and more than two messages per window under the publish rate for--lag-windows(default 3) consecutive windows; it clears under half the tolerance and holds in between. A publish observation older than 1.5 periods cannot pair, so a dead or idle publisher (recv reads an explicit 0.0, KNOWN_ISSUES #12) is not lag; trackers are keyed by topic and source log, so a healthy subscriber process does not mask a lagging one, and a warn whose subscriber stopped flushing clears by time. Amber in the table (RECV cell), strip and Warns tab, with deficit, windows and source file in the sidebar; the text says the probe counts callbacks, not wire samples, so it cannot tell a drop from a backlog. Derived by the consumer: the probe, its output format, the spec grammar andpulse-checkare unchanged. Test node modeslow_listener <ms>andtest/integration/test_recv_lag.pyprove the two logs carry the gap and the model derives the warn from them; 21 new pulse-top tests. -
Blog post, “Watching a ROS 2 topic changes it”
(
docs/blog/2026-09-18-watching-a-ros2-topic-changes-it.md, on the docs site under Blog). The observer-effect bench written up for a systems-programming audience: what a subscriber costs (hz7 %,echo31 % of a core per watched 100 KB topic), whyhzon an intra-process topic switches serialization on in the watched process (+52 % CPU, 10/10 trials), howLD_PRELOADinterposition of theros_trace_*symbols counts in-process instead, and what that costs (+1.9 % ± 0.7 % paired). Every number cites its file and line in a trailing comment. Two figures underdocs/assets/blog/, regenerated from the committed CSV bybench/plot_observer_effect.py.site/build.pynow rewrites links relative to the page’s own directory (pages underblog/), and folds../in link targets, so a results page linking../../bench/RESULTS.mdlands on the benchmarks page instead of GitHub.
[0.5.0] - 2026-09-09
Adds an optional /statistics sidecar. The probe itself is unchanged.
Added
-
pulse_bridge(ros2 run ros2_pulse pulse_bridge): tails the probe’s jsonl log(s) and republishes every window on/statisticsasstatistics_msgs/MetricsMessage, in the shape rclcpp’s built-in topic statistics use (unitms,AVERAGE= message period,SAMPLE_COUNT,MAXIMUM= largest gap when measured), so existing consumers of that topic read pulse windows, intra-process included, with no integration work. Parameters:files,glob(default$TMPDIR/topic_freq.*.log, re-expanded every poll),topic,unit(ms|Hz),poll_period_s,source_name. Runs as its own process so the probe stays out of the DDS graph and free of rclcpp;package.xmlnow declaresrclcppandstatistics_msgsfor this executable only. Rate is measured at the subscription when the process has one, at the publisher otherwise; inter/intra report the busier path, never the sum. Text-format logs are refused with one warning per file. Asked for on ROS Discourse (topic 57637). -
core
metrics_mapperandline_follower: the window-to-sample mapping and the incremental line reader behind the bridge, ROS-free so both run in the standalone gtest lane
File truncated at 100 lines see the full file
Package Dependencies
| Deps | Name |
|---|---|
| ament_cmake | |
| ament_cmake_gtest | |
| ament_cmake_pytest | |
| rclpy | |
| std_msgs | |
| ros2run | |
| rclcpp | |
| statistics_msgs |
System Dependencies
| Name |
|---|
| lttng-tools |
Dependant Packages
Launch files
Messages
Services
Plugins
Recent questions tagged ros2_pulse at Robotics Stack Exchange
|
|
ros2_pulse package from ros2_pulse reporos2_pulse |
ROS Distro
|
Package Summary
| Version | 0.5.0 |
| License | Apache-2.0 |
| Build type | AMENT_CMAKE |
| Use | RECOMMENDED |
Repository Summary
| Checkout URI | https://github.com/TanayK07/ros2_pulse.git |
| VCS Type | git |
| VCS Version | main |
| Last Updated | 2026-10-02 |
| Dev Status | DEVELOPED |
| Released | RELEASED |
| Contributing |
Help Wanted (-)
Good First Issues (-) Pull Requests to Review (-) |
Package Description
Additional Links
Maintainers
- Tanay Kedia
Authors
ros2_pulse
The heartbeat of your ROS 2 graph. A low-overhead probe that measures per-topic message rate and active-node liveness for both inter-process and intra-process traffic, on stock ROS 2 binaries, with no rebuild, no privileges and no network traffic. The counting hot path costs under a nanosecond per message; the whole probe costs about 2 % of workload CPU on a harsh 4,900 msg/s stress and less on real graphs.
pulse-top --demo: the probe’s log, live. Sparklines per topic, intra-process rates, structured warnings with ages. Install: pip3 install ros2-pulse-top (details).
Forty seconds on what watching a topic costs and what the probe does instead. Watch the video (40 s, YouTube) or read the docs.
The long version, for systems programmers: Watching a ROS 2 topic changes it, the observer-effect measurement and the symbol-interposition trick that avoids it.
Why
The question in production is simple: is every topic flowing at the rate it should, and which nodes are alive? The existing tools each fall short of answering it.
-
ros2 topic hzandros2 topic echosubscribe to one topic at a time. Watching a single 100 KB topic costs 7 % of a core withhzand 31 % withecho, they cannot see intra-process messages at all, and pointinghzat an intra-process topic makes the publisher start serializing every message, which raised the watched process’s CPU by 52 % in our measurements. - Built-in topic statistics are
bypassed by intra-process comms on Humble-class
binaries, so composable nodes carrying point clouds lose all introspection. This is fixed on
rollingand newer by rclcpp#3130 (merged April 2026); there is no public Humble backport as of this writing. -
ros2_tracing/ LTTng is built for offline analysis: a session daemon plus post-processing of a CTF trace just to get a rate. On Humble it also needs ROS rebuilt with the lttng-ust backend (Jazzy and newer trace out of the box). - CARET (Tier IV) uses the same hook layer as this probe, LD_PRELOAD over tracetools, which is a useful independent validation of the mechanism. It is built for deep offline latency and chain analysis and needs LTTng, a forked rclcpp and Jupyter post-processing. Complementary, not always-on.
- eBPF uprobes need
CAP_SYS_ADMIN, debugfs and a kernel with BTF and uprobes, which is often a non-starter on Jetson and other embedded targets, and they pay a kernel trap per message.
ros2_pulse hooks the tracetools instrumentation layer that rclcpp already calls on every
publish and every callback, counts in-process with a lock-free hot path, and writes ready-to-read
Hz to a small rolling file.
What you get
# ts_ns=1782887153899445923 window_s=5.000
TOPIC /scan 20.000000                      # publish-side, inter-process
PUB   /points inter=0.000000 intra=30.000000   # publish-side incl. intra (Iron+)
RECV  /scan inter=20.000000 intra=0.000000 # receive-side, BOTH transports
RECV  /points inter=0.000000 intra=30.000000   # <- intra-process, invisible to other tools on Humble
JITTER /scan recv max_dt_ms=21.284             # largest inter-arrival gap (opt-in, see below)
NODE  /perception
NODE  /planner
WARN  TOPIC /scan hz=1.200000 expected=[18,22]  # only with an expected-rate spec (see below)
If a sidecar exporter or a log shipper is reading instead of a person, ROS_TOPIC_STATS_FORMAT=jsonl
writes every window as one JSON object per line with the same gates and values. See
JSON Lines output. Dashboards that already
read rclcpp’s built-in topic statistics get the same numbers on /statistics from the
pulse_bridge sidecar, and Prometheus, OTLP and
Grafana get them from pulse-export.
How it works
libros2_pulse.so is injected with LD_PRELOAD. It exports the same symbols as
libtracetools.so’s tracepoint API (ros_trace_rcl_publish, ros_trace_callback_start, the
init tracepoints and so on). The dynamic linker binds rclcpp’s calls to ours first; each
interposer records a stat and forwards to the real function through dlsym(RTLD_NEXT, ...).
rclcpp calls these functions unconditionally (the LTTng enable check is inside them), so the
probe works with no tracing session and adds no DDS traffic.
- Intra-process visibility comes from
callback_start(callback, is_intra_process), which fires for every subscription callback regardless of transport. - The hot path is a per-endpoint relaxed atomic increment behind a 256-slot thread-local cache with a stride-breaking hash. No global lock, no per-message string hashing. Counting costs about 0.3 ns/op on a fixed endpoint and 0.6 to 1.2 ns/op alternating across a working set on the reference box, two orders of magnitude under a single LTTng-UST tracepoint (about 158 ns).
- A background timer snapshots and resets the counts every
ROS_TOPIC_STATISTICS_PUBLISH_PERIODseconds and appends the rates toROS_TOPIC_STATS_OUTPUT_FILE.
The pure C++ core (core/) has no ROS dependency and is unit tested on its own; the probe layer
(probe/) is a thin LD_PRELOAD shim.
Install
apt
File truncated at 100 lines see the full file
Changelog
All notable changes to this project are documented here. Format follows Keep a Changelog; versions follow SemVer.
[Unreleased]
Fixed
-
pulse-top 0.4.1: pulse-top found no files on a default-format stack (issue #58). With the
probe in
.bashrcand noROS_TOPIC_STATS_FORMAT, every log is in the default text format. pulse-top parsed jsonl only, and it redrew the top bar only after a parsed window, so a directory of healthy text logs read “0 file(s)” forever even though the glob had matched them all. pulse-top and pulse-export now read the text format as well, sniffed per line like the C++log_reader, and a text window maps to the sameWindowits jsonl twin parses to (a line the probe did not print stays an absent field, never 0). The top bar is redrawn every tick, puts the file count before the path, and a notice line says why the table is empty: no file matches yet, N files found and waiting for the first window, or which files are not probe output. The follower now keeps blank lines, which close a text window, so no window arrives one period late. pulse-export’slines_skipped_totalcounts only lines that are in neither format. -
pulse-top 0.4.1:
--theme light|dark|terminalandPULSE_TOP_THEME(issue #59). The colours were hard-coded for a dark background, unreadable on the white terminals used outdoors.lightis black on white with warn colours picked to read on white (amber is brown, not yellow);terminalpaints nothing and uses the terminal’s own background and ANSI palette (Textual’sansi-darktheme);darkstays the default. The stylesheet now takes every colour from the Textual theme. The active tab’s label was invisible while the tab bar had focus (purple on purple) and is readable again. Textual floor raised to 8.2.7 for the ANSI theme. -
A publisher frozen by SIGSTOP read as a ~0 ms gap after it resumed. The flush timer
advanced its deadline one interval per fire, so when the whole probed process was frozen (the
flush thread with it) it replayed every missed tick back to back on SIGCONT: one window
carrying the stall, then a burst of ~0-length windows with a near-0
pub_max_dt_ms/recv_max_dt_msand nonsense Hz (50,000 Hz in one run). pulse-top and pulse-export keep the latest window, so a 5 s camera freeze showed as a 0.03 ms gap and thetopic_gapwarn was buried. The timer now re-phases instead of replaying: after a stall there is exactly one long window holding the full gap (5021 ms on the same repro), then normal cadence, and no window is ever shorter than half a period. Same fix on the receive side (a frozen subscriber process). The gap accounting itself was already right and is unchanged; the hot path is untouched. Regression testTimer.NoCatchUpBurstAfterStall.
Changed
- docs/ALTERNATIVES.md compares against NVIDIA’s
greenwave_monitor, the packaged subscriber-based monitor a Discourse reader said they were switching from; section plus a positioning-table row.
Added
-
pulse-top 0.4.0:
pulse-export, Prometheus / OTLP exporter and a Grafana example. A second entry point inros2-pulse-topthat tails the probe’s jsonl logs with pulse-top’s follower and parser and serves/metricsin the Prometheus text format on port 9464 from a stdlib HTTP server: per-topic publish and callback rate per path, largest gap,recv_lagdeficit, active warns, node up and last-seen age, per-process window period, age and timestamp, and window / warn / skipped-line counters, labelledpid(fromtopic_freq.<pid>.log),topic,node.--otlp URLpushes the same series as OTLP/HTTP JSON throughurllib(gauges, cumulative sums, UCUM units; checked against OpenTelemetry Collector 0.128.0). Absent keys stay absent series, never 0; a process that stops flushing loses its topic series after two periods and keeps a growing age. No new dependency.examples/grafana/holds a docker compose (exporter, Prometheus, Grafana) and a provisioned dashboard,--demoincluded; docs pagedocs/EXPORT.md.default_log_pathmoved fromapp.pytoreader.pyso the exporter does not import the TUI. 19 new pulse-top tests. -
pulse-top 0.3.0:
recv_lagwarn (issue #50). When a publisher’s process and a subscriber’s process are both probed, pulse-top pairs the topic’s publish rate (busier path) with its callback rate (inter + intra) and warns once the callbacks sit more than--lag-tol(default 10%) and more than two messages per window under the publish rate for--lag-windows(default 3) consecutive windows; it clears under half the tolerance and holds in between. A publish observation older than 1.5 periods cannot pair, so a dead or idle publisher (recv reads an explicit 0.0, KNOWN_ISSUES #12) is not lag; trackers are keyed by topic and source log, so a healthy subscriber process does not mask a lagging one, and a warn whose subscriber stopped flushing clears by time. Amber in the table (RECV cell), strip and Warns tab, with deficit, windows and source file in the sidebar; the text says the probe counts callbacks, not wire samples, so it cannot tell a drop from a backlog. Derived by the consumer: the probe, its output format, the spec grammar andpulse-checkare unchanged. Test node modeslow_listener <ms>andtest/integration/test_recv_lag.pyprove the two logs carry the gap and the model derives the warn from them; 21 new pulse-top tests. -
Blog post, “Watching a ROS 2 topic changes it”
(
docs/blog/2026-09-18-watching-a-ros2-topic-changes-it.md, on the docs site under Blog). The observer-effect bench written up for a systems-programming audience: what a subscriber costs (hz7 %,echo31 % of a core per watched 100 KB topic), whyhzon an intra-process topic switches serialization on in the watched process (+52 % CPU, 10/10 trials), howLD_PRELOADinterposition of theros_trace_*symbols counts in-process instead, and what that costs (+1.9 % ± 0.7 % paired). Every number cites its file and line in a trailing comment. Two figures underdocs/assets/blog/, regenerated from the committed CSV bybench/plot_observer_effect.py.site/build.pynow rewrites links relative to the page’s own directory (pages underblog/), and folds../in link targets, so a results page linking../../bench/RESULTS.mdlands on the benchmarks page instead of GitHub.
[0.5.0] - 2026-09-09
Adds an optional /statistics sidecar. The probe itself is unchanged.
Added
-
pulse_bridge(ros2 run ros2_pulse pulse_bridge): tails the probe’s jsonl log(s) and republishes every window on/statisticsasstatistics_msgs/MetricsMessage, in the shape rclcpp’s built-in topic statistics use (unitms,AVERAGE= message period,SAMPLE_COUNT,MAXIMUM= largest gap when measured), so existing consumers of that topic read pulse windows, intra-process included, with no integration work. Parameters:files,glob(default$TMPDIR/topic_freq.*.log, re-expanded every poll),topic,unit(ms|Hz),poll_period_s,source_name. Runs as its own process so the probe stays out of the DDS graph and free of rclcpp;package.xmlnow declaresrclcppandstatistics_msgsfor this executable only. Rate is measured at the subscription when the process has one, at the publisher otherwise; inter/intra report the busier path, never the sum. Text-format logs are refused with one warning per file. Asked for on ROS Discourse (topic 57637). -
core
metrics_mapperandline_follower: the window-to-sample mapping and the incremental line reader behind the bridge, ROS-free so both run in the standalone gtest lane
File truncated at 100 lines see the full file
Package Dependencies
| Deps | Name |
|---|---|
| ament_cmake | |
| ament_cmake_gtest | |
| ament_cmake_pytest | |
| rclpy | |
| std_msgs | |
| ros2run | |
| rclcpp | |
| statistics_msgs |
System Dependencies
| Name |
|---|
| lttng-tools |
Dependant Packages
Launch files
Messages
Services
Plugins
Recent questions tagged ros2_pulse at Robotics Stack Exchange
|
|
ros2_pulse package from ros2_pulse reporos2_pulse |
ROS Distro
|
Package Summary
| Version | 0.5.0 |
| License | Apache-2.0 |
| Build type | AMENT_CMAKE |
| Use | RECOMMENDED |
Repository Summary
| Checkout URI | https://github.com/TanayK07/ros2_pulse.git |
| VCS Type | git |
| VCS Version | main |
| Last Updated | 2026-10-02 |
| Dev Status | DEVELOPED |
| Released | RELEASED |
| Contributing |
Help Wanted (-)
Good First Issues (-) Pull Requests to Review (-) |
Package Description
Additional Links
Maintainers
- Tanay Kedia
Authors
ros2_pulse
The heartbeat of your ROS 2 graph. A low-overhead probe that measures per-topic message rate and active-node liveness for both inter-process and intra-process traffic, on stock ROS 2 binaries, with no rebuild, no privileges and no network traffic. The counting hot path costs under a nanosecond per message; the whole probe costs about 2 % of workload CPU on a harsh 4,900 msg/s stress and less on real graphs.
pulse-top --demo: the probe’s log, live. Sparklines per topic, intra-process rates, structured warnings with ages. Install: pip3 install ros2-pulse-top (details).
Forty seconds on what watching a topic costs and what the probe does instead. Watch the video (40 s, YouTube) or read the docs.
The long version, for systems programmers: Watching a ROS 2 topic changes it, the observer-effect measurement and the symbol-interposition trick that avoids it.
Why
The question in production is simple: is every topic flowing at the rate it should, and which nodes are alive? The existing tools each fall short of answering it.
-
ros2 topic hzandros2 topic echosubscribe to one topic at a time. Watching a single 100 KB topic costs 7 % of a core withhzand 31 % withecho, they cannot see intra-process messages at all, and pointinghzat an intra-process topic makes the publisher start serializing every message, which raised the watched process’s CPU by 52 % in our measurements. - Built-in topic statistics are
bypassed by intra-process comms on Humble-class
binaries, so composable nodes carrying point clouds lose all introspection. This is fixed on
rollingand newer by rclcpp#3130 (merged April 2026); there is no public Humble backport as of this writing. -
ros2_tracing/ LTTng is built for offline analysis: a session daemon plus post-processing of a CTF trace just to get a rate. On Humble it also needs ROS rebuilt with the lttng-ust backend (Jazzy and newer trace out of the box). - CARET (Tier IV) uses the same hook layer as this probe, LD_PRELOAD over tracetools, which is a useful independent validation of the mechanism. It is built for deep offline latency and chain analysis and needs LTTng, a forked rclcpp and Jupyter post-processing. Complementary, not always-on.
- eBPF uprobes need
CAP_SYS_ADMIN, debugfs and a kernel with BTF and uprobes, which is often a non-starter on Jetson and other embedded targets, and they pay a kernel trap per message.
ros2_pulse hooks the tracetools instrumentation layer that rclcpp already calls on every
publish and every callback, counts in-process with a lock-free hot path, and writes ready-to-read
Hz to a small rolling file.
What you get
# ts_ns=1782887153899445923 window_s=5.000
TOPIC /scan 20.000000                      # publish-side, inter-process
PUB   /points inter=0.000000 intra=30.000000   # publish-side incl. intra (Iron+)
RECV  /scan inter=20.000000 intra=0.000000 # receive-side, BOTH transports
RECV  /points inter=0.000000 intra=30.000000   # <- intra-process, invisible to other tools on Humble
JITTER /scan recv max_dt_ms=21.284             # largest inter-arrival gap (opt-in, see below)
NODE  /perception
NODE  /planner
WARN  TOPIC /scan hz=1.200000 expected=[18,22]  # only with an expected-rate spec (see below)
If a sidecar exporter or a log shipper is reading instead of a person, ROS_TOPIC_STATS_FORMAT=jsonl
writes every window as one JSON object per line with the same gates and values. See
JSON Lines output. Dashboards that already
read rclcpp’s built-in topic statistics get the same numbers on /statistics from the
pulse_bridge sidecar, and Prometheus, OTLP and
Grafana get them from pulse-export.
How it works
libros2_pulse.so is injected with LD_PRELOAD. It exports the same symbols as
libtracetools.so’s tracepoint API (ros_trace_rcl_publish, ros_trace_callback_start, the
init tracepoints and so on). The dynamic linker binds rclcpp’s calls to ours first; each
interposer records a stat and forwards to the real function through dlsym(RTLD_NEXT, ...).
rclcpp calls these functions unconditionally (the LTTng enable check is inside them), so the
probe works with no tracing session and adds no DDS traffic.
- Intra-process visibility comes from
callback_start(callback, is_intra_process), which fires for every subscription callback regardless of transport. - The hot path is a per-endpoint relaxed atomic increment behind a 256-slot thread-local cache with a stride-breaking hash. No global lock, no per-message string hashing. Counting costs about 0.3 ns/op on a fixed endpoint and 0.6 to 1.2 ns/op alternating across a working set on the reference box, two orders of magnitude under a single LTTng-UST tracepoint (about 158 ns).
- A background timer snapshots and resets the counts every
ROS_TOPIC_STATISTICS_PUBLISH_PERIODseconds and appends the rates toROS_TOPIC_STATS_OUTPUT_FILE.
The pure C++ core (core/) has no ROS dependency and is unit tested on its own; the probe layer
(probe/) is a thin LD_PRELOAD shim.
Install
apt
File truncated at 100 lines see the full file
Changelog
All notable changes to this project are documented here. Format follows Keep a Changelog; versions follow SemVer.
[Unreleased]
Fixed
-
pulse-top 0.4.1: pulse-top found no files on a default-format stack (issue #58). With the
probe in
.bashrcand noROS_TOPIC_STATS_FORMAT, every log is in the default text format. pulse-top parsed jsonl only, and it redrew the top bar only after a parsed window, so a directory of healthy text logs read “0 file(s)” forever even though the glob had matched them all. pulse-top and pulse-export now read the text format as well, sniffed per line like the C++log_reader, and a text window maps to the sameWindowits jsonl twin parses to (a line the probe did not print stays an absent field, never 0). The top bar is redrawn every tick, puts the file count before the path, and a notice line says why the table is empty: no file matches yet, N files found and waiting for the first window, or which files are not probe output. The follower now keeps blank lines, which close a text window, so no window arrives one period late. pulse-export’slines_skipped_totalcounts only lines that are in neither format. -
pulse-top 0.4.1:
--theme light|dark|terminalandPULSE_TOP_THEME(issue #59). The colours were hard-coded for a dark background, unreadable on the white terminals used outdoors.lightis black on white with warn colours picked to read on white (amber is brown, not yellow);terminalpaints nothing and uses the terminal’s own background and ANSI palette (Textual’sansi-darktheme);darkstays the default. The stylesheet now takes every colour from the Textual theme. The active tab’s label was invisible while the tab bar had focus (purple on purple) and is readable again. Textual floor raised to 8.2.7 for the ANSI theme. -
A publisher frozen by SIGSTOP read as a ~0 ms gap after it resumed. The flush timer
advanced its deadline one interval per fire, so when the whole probed process was frozen (the
flush thread with it) it replayed every missed tick back to back on SIGCONT: one window
carrying the stall, then a burst of ~0-length windows with a near-0
pub_max_dt_ms/recv_max_dt_msand nonsense Hz (50,000 Hz in one run). pulse-top and pulse-export keep the latest window, so a 5 s camera freeze showed as a 0.03 ms gap and thetopic_gapwarn was buried. The timer now re-phases instead of replaying: after a stall there is exactly one long window holding the full gap (5021 ms on the same repro), then normal cadence, and no window is ever shorter than half a period. Same fix on the receive side (a frozen subscriber process). The gap accounting itself was already right and is unchanged; the hot path is untouched. Regression testTimer.NoCatchUpBurstAfterStall.
Changed
- docs/ALTERNATIVES.md compares against NVIDIA’s
greenwave_monitor, the packaged subscriber-based monitor a Discourse reader said they were switching from; section plus a positioning-table row.
Added
-
pulse-top 0.4.0:
pulse-export, Prometheus / OTLP exporter and a Grafana example. A second entry point inros2-pulse-topthat tails the probe’s jsonl logs with pulse-top’s follower and parser and serves/metricsin the Prometheus text format on port 9464 from a stdlib HTTP server: per-topic publish and callback rate per path, largest gap,recv_lagdeficit, active warns, node up and last-seen age, per-process window period, age and timestamp, and window / warn / skipped-line counters, labelledpid(fromtopic_freq.<pid>.log),topic,node.--otlp URLpushes the same series as OTLP/HTTP JSON throughurllib(gauges, cumulative sums, UCUM units; checked against OpenTelemetry Collector 0.128.0). Absent keys stay absent series, never 0; a process that stops flushing loses its topic series after two periods and keeps a growing age. No new dependency.examples/grafana/holds a docker compose (exporter, Prometheus, Grafana) and a provisioned dashboard,--demoincluded; docs pagedocs/EXPORT.md.default_log_pathmoved fromapp.pytoreader.pyso the exporter does not import the TUI. 19 new pulse-top tests. -
pulse-top 0.3.0:
recv_lagwarn (issue #50). When a publisher’s process and a subscriber’s process are both probed, pulse-top pairs the topic’s publish rate (busier path) with its callback rate (inter + intra) and warns once the callbacks sit more than--lag-tol(default 10%) and more than two messages per window under the publish rate for--lag-windows(default 3) consecutive windows; it clears under half the tolerance and holds in between. A publish observation older than 1.5 periods cannot pair, so a dead or idle publisher (recv reads an explicit 0.0, KNOWN_ISSUES #12) is not lag; trackers are keyed by topic and source log, so a healthy subscriber process does not mask a lagging one, and a warn whose subscriber stopped flushing clears by time. Amber in the table (RECV cell), strip and Warns tab, with deficit, windows and source file in the sidebar; the text says the probe counts callbacks, not wire samples, so it cannot tell a drop from a backlog. Derived by the consumer: the probe, its output format, the spec grammar andpulse-checkare unchanged. Test node modeslow_listener <ms>andtest/integration/test_recv_lag.pyprove the two logs carry the gap and the model derives the warn from them; 21 new pulse-top tests. -
Blog post, “Watching a ROS 2 topic changes it”
(
docs/blog/2026-09-18-watching-a-ros2-topic-changes-it.md, on the docs site under Blog). The observer-effect bench written up for a systems-programming audience: what a subscriber costs (hz7 %,echo31 % of a core per watched 100 KB topic), whyhzon an intra-process topic switches serialization on in the watched process (+52 % CPU, 10/10 trials), howLD_PRELOADinterposition of theros_trace_*symbols counts in-process instead, and what that costs (+1.9 % ± 0.7 % paired). Every number cites its file and line in a trailing comment. Two figures underdocs/assets/blog/, regenerated from the committed CSV bybench/plot_observer_effect.py.site/build.pynow rewrites links relative to the page’s own directory (pages underblog/), and folds../in link targets, so a results page linking../../bench/RESULTS.mdlands on the benchmarks page instead of GitHub.
[0.5.0] - 2026-09-09
Adds an optional /statistics sidecar. The probe itself is unchanged.
Added
-
pulse_bridge(ros2 run ros2_pulse pulse_bridge): tails the probe’s jsonl log(s) and republishes every window on/statisticsasstatistics_msgs/MetricsMessage, in the shape rclcpp’s built-in topic statistics use (unitms,AVERAGE= message period,SAMPLE_COUNT,MAXIMUM= largest gap when measured), so existing consumers of that topic read pulse windows, intra-process included, with no integration work. Parameters:files,glob(default$TMPDIR/topic_freq.*.log, re-expanded every poll),topic,unit(ms|Hz),poll_period_s,source_name. Runs as its own process so the probe stays out of the DDS graph and free of rclcpp;package.xmlnow declaresrclcppandstatistics_msgsfor this executable only. Rate is measured at the subscription when the process has one, at the publisher otherwise; inter/intra report the busier path, never the sum. Text-format logs are refused with one warning per file. Asked for on ROS Discourse (topic 57637). -
core
metrics_mapperandline_follower: the window-to-sample mapping and the incremental line reader behind the bridge, ROS-free so both run in the standalone gtest lane
File truncated at 100 lines see the full file
Package Dependencies
| Deps | Name |
|---|---|
| ament_cmake | |
| ament_cmake_gtest | |
| ament_cmake_pytest | |
| rclpy | |
| std_msgs | |
| ros2run | |
| rclcpp | |
| statistics_msgs |
System Dependencies
| Name |
|---|
| lttng-tools |