 ROS Index
Repository Summary
| Checkout URI | https://github.com/samuelba/rqt_multiplot_plugin.git |
| VCS Type | git |
| VCS Version | main |
| Last Updated | 2026-10-02 |
| Dev Status | MAINTAINED |
| Released | UNRELEASED |
| Contributing |
Help Wanted (-)
Good First Issues (-) Pull Requests to Review (-) |
Packages
| Name | Version |
|---|---|
| rqt_multiplot | 0.0.37 |
README
Rqt Multiplot Plugin


Plots numeric ROS 2 message fields in tiled 2D charts (Qwt). Nested splits and tabs give a layout that is not a strict grid. Subscribe to live topics or import a rosbag2, then inspect values with a linked cursor and a curve-values sidebar. Runs as its own window or as an rqt plugin.

Authors: Ralf Kaestner, Samuel Bachmann
Maintainer: Samuel Bachmann
License: GNU Lesser General Public License v3.0 (LGPL-3.0)
ROS2 distributions: Jazzy, Kilted, Lyrical, Rolling
Features
- Nested plot layout — split any plot left/right or top/bottom and nest splits (two on the left, one on the right). Drag splitter handles; reset the active tab to even sizes. Ratios are stored in the XML
- Tabs — multiple named layouts in one window; each tab has its own plots, colors, grid, and link/track settings
-
Live topics and rosbag2 — subscribe while running, or import
.mcap/.db3files and bag directories - Linked plots — shared scale and cursor; optional point tracking under the pointer; click a legend item to hide a curve
- Curve values — collapsible per-tab list of each curve’s latest X and Y, grouped by plot
- Time axes — message receipt time, start from zero, date-time labels, or raw stamps. Time zone in File → Preferences (local, UTC, or IANA). Optional plot-level Time window (last N seconds)
- Log scale — optional log scale on a plot’s X or Y axis. Values <= 0 are drawn below the axis. Time axes stay linear, and a log plot stays out of linked scale
- Light and dark — theme and plot-title size, weight, and color under File → Preferences. Changes apply to the open plots
-
Configs and export — File menu: open/save XML (
file://,home://,package://); import or add bags; export PNG, SVG, PDF, TXT, or CSV. Unsaved layout changes prompt on close. Older row×column files still load - Data statistics — right click on a plot to open the data statistics dialog, showing the mean, std, min, max, median, mode, range, count, RMS, and sum of the data
- Array curves — plot a whole array vs index (or vs another array field); the series is replaced on each message
-
Diagnostic messages — plot diagnostic messages from the
/diagnosticsor/diagnostics_aggtopic -
Topic metrics — plot the rate, bandwidth, and delay of a topic, as
ros2 topic hz,bw, anddelayshow them - Topic browser — browse live and bag topics, then drag’n’drop a field onto a plot
- Curve filters — ordered chain on a curve’s Y series: derivative, integral, moving average, low-pass, and others. Drag a filter onto a plot, or edit the chain in the curve dialog
- Markers — two vertical markers A and B per plot, with Δt and per-curve Δy and slope, to measure latency, rise time, or settling time
Also: run / pause / clear, circular and time-frame buffers, rad ↔ deg on an axis, grid on/off, drag-and-drop of curves between plot legends.
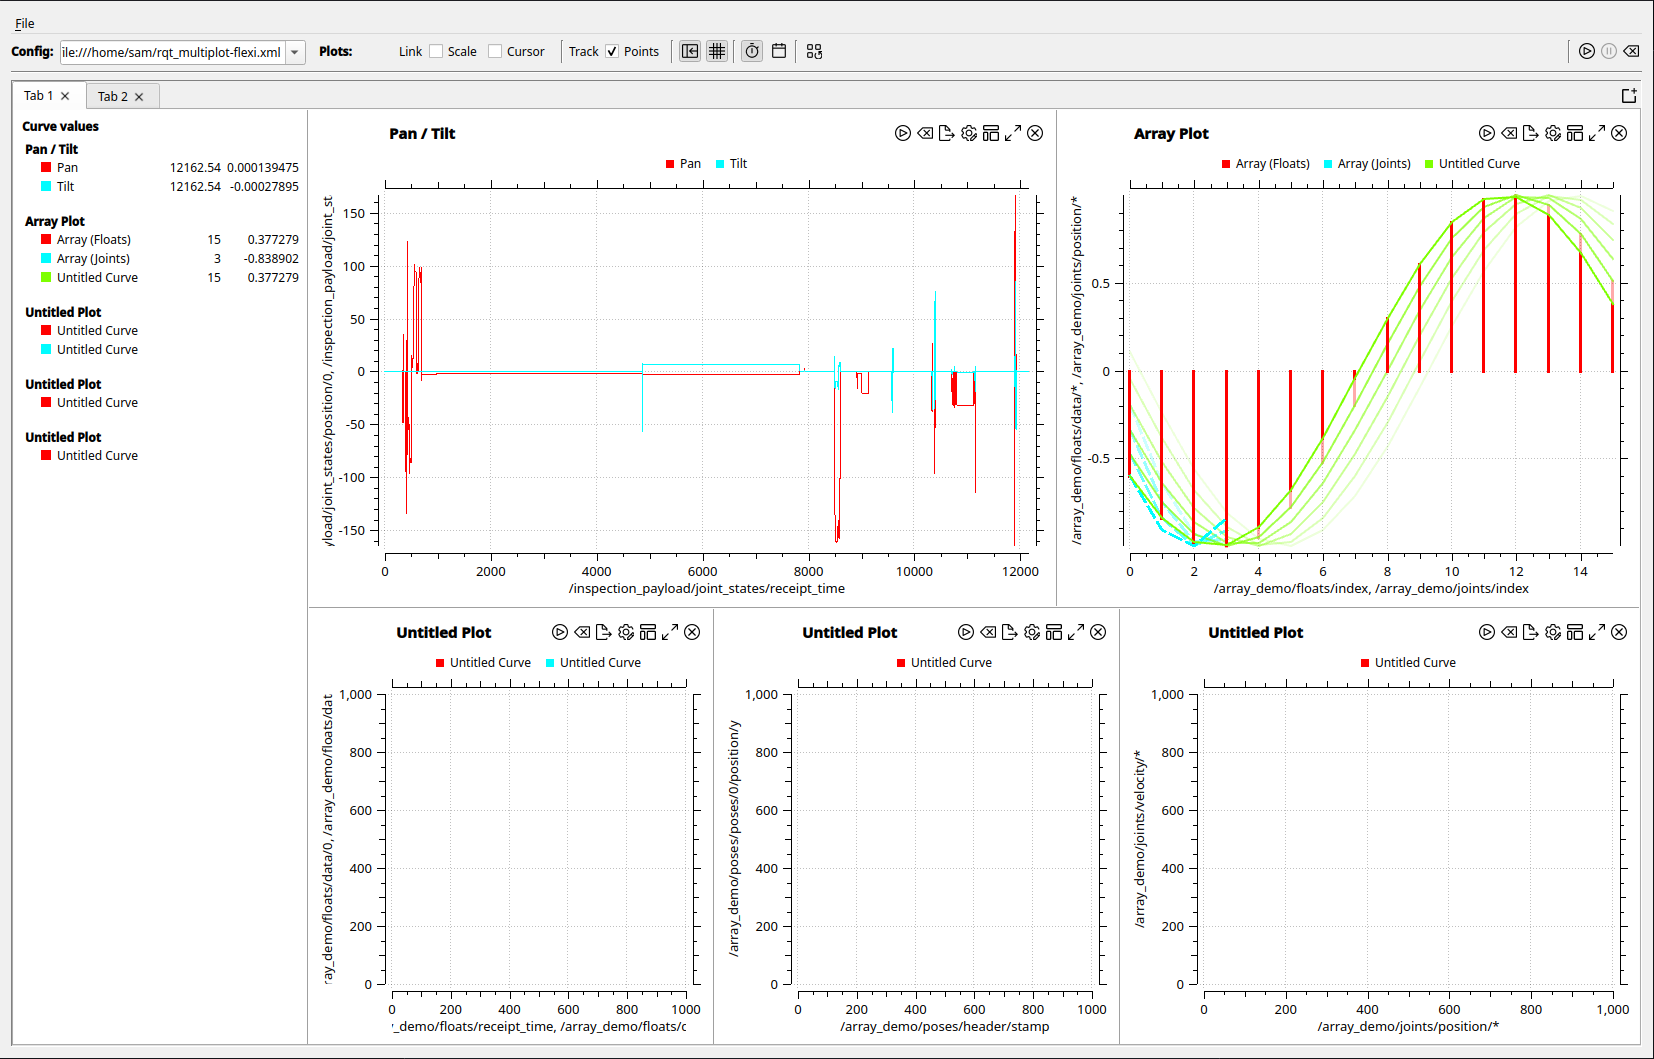
Light |
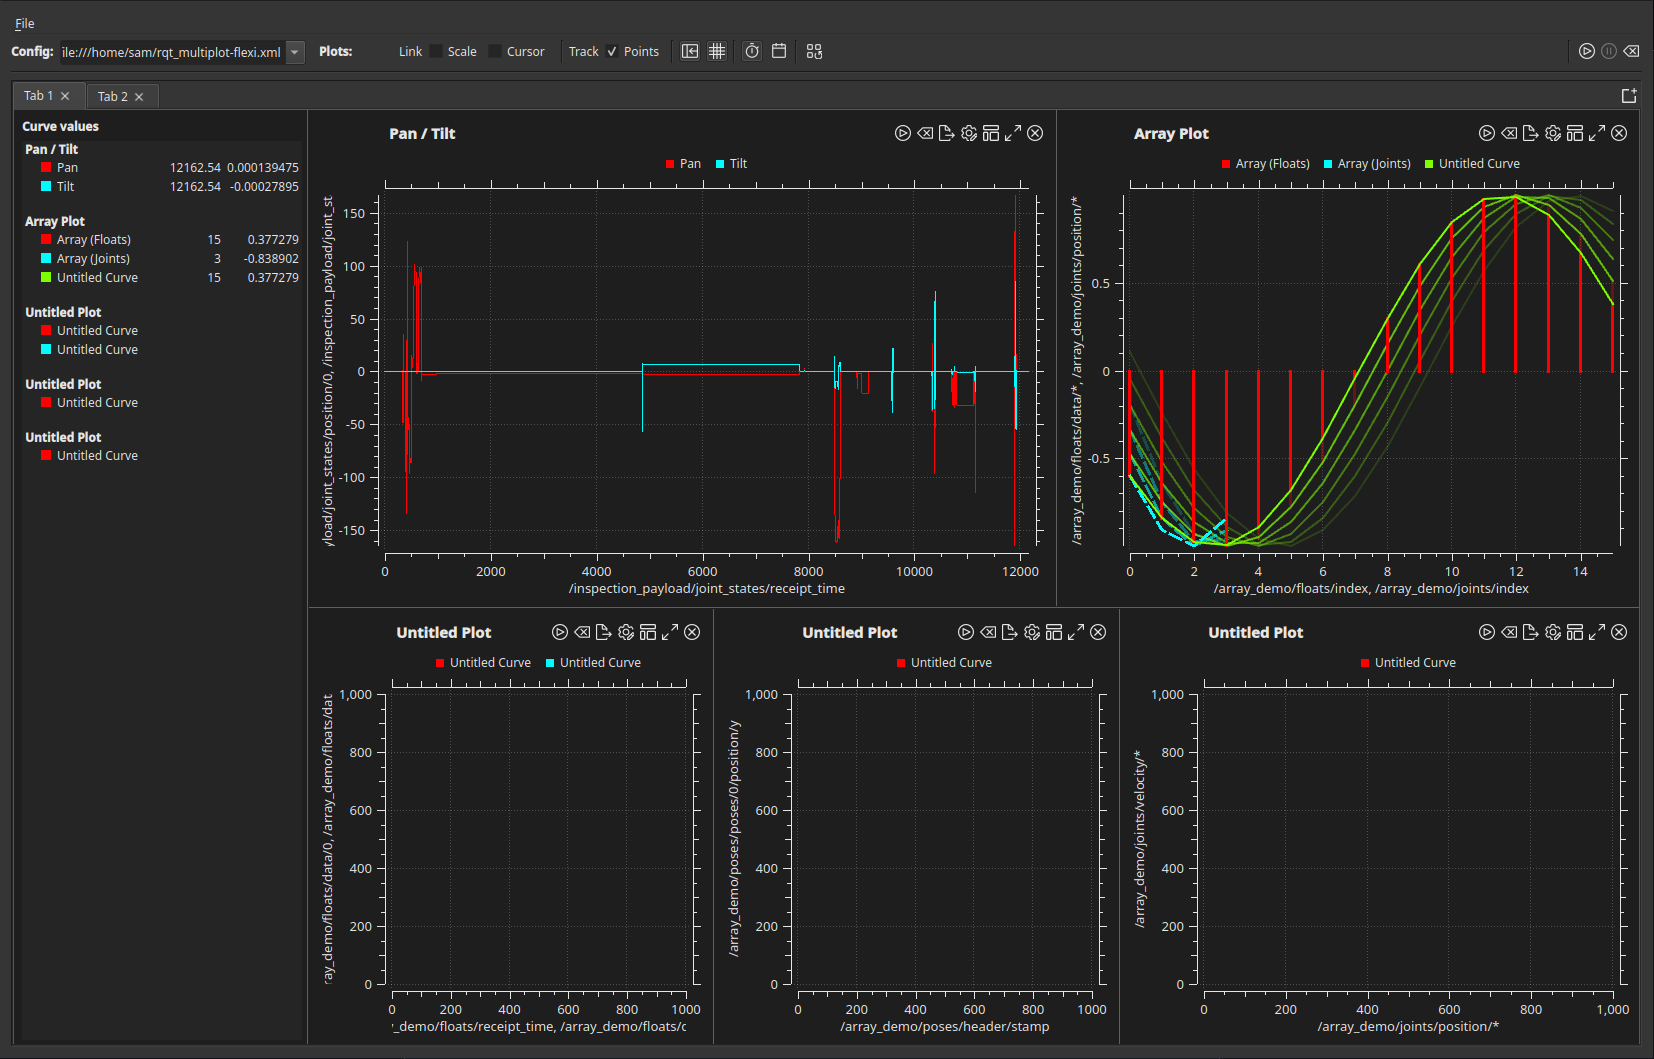
Dark |
Installation
ROS distribution
Coming soon. The package is not on the ROS build farm yet. After release:
sudo apt-get update
sudo apt-get install ros-jazzy-rqt-multiplot
sudo apt-get install ros-kilted-rqt-multiplot
sudo apt-get install ros-lyrical-rqt-multiplot
sudo apt-get install ros-rolling-rqt-multiplot
Building from source
Tested on ROS 2 Jazzy, Kilted, Lyrical, and Rolling. Put this repository in a colcon workspace src folder (clone or symlink), then:
cd ~/colcon_ws
rosdep install --from-paths src --ignore-src -y
colcon build --packages-select rqt_multiplot
source install/setup.bash
Usage
Standalone window (no rqt):
ros2 run rqt_multiplot multiplot
rqt plugin, either in its own rqt window or inside rqt (Plugins → Visualization → Multiplot):
ros2 run rqt_multiplot rqt_multiplot
rqt --force-discover
If the rqt plugin list or layout is broken:
rqt --clear-config
File truncated at 100 lines see the full file
CONTRIBUTING
Repository Summary
| Checkout URI | https://github.com/samuelba/rqt_multiplot_plugin.git |
| VCS Type | git |
| VCS Version | main |
| Last Updated | 2026-10-02 |
| Dev Status | MAINTAINED |
| Released | UNRELEASED |
| Contributing |
Help Wanted (-)
Good First Issues (-) Pull Requests to Review (-) |
Packages
| Name | Version |
|---|---|
| rqt_multiplot | 0.0.37 |
README
Rqt Multiplot Plugin
Plots numeric ROS 2 message fields in tiled 2D charts (Qwt). Nested splits and tabs give a layout that is not a strict grid. Subscribe to live topics or import a rosbag2, then inspect values with a linked cursor and a curve-values sidebar. Runs as its own window or as an rqt plugin.
Authors: Ralf Kaestner, Samuel Bachmann
Maintainer: Samuel Bachmann
License: GNU Lesser General Public License v3.0 (LGPL-3.0)
ROS2 distributions: Jazzy, Kilted, Lyrical, Rolling
Features
- Nested plot layout — split any plot left/right or top/bottom and nest splits (two on the left, one on the right). Drag splitter handles; reset the active tab to even sizes. Ratios are stored in the XML
- Tabs — multiple named layouts in one window; each tab has its own plots, colors, grid, and link/track settings
-
Live topics and rosbag2 — subscribe while running, or import
.mcap/.db3files and bag directories - Linked plots — shared scale and cursor; optional point tracking under the pointer; click a legend item to hide a curve
- Curve values — collapsible per-tab list of each curve’s latest X and Y, grouped by plot
- Time axes — message receipt time, start from zero, date-time labels, or raw stamps. Time zone in File → Preferences (local, UTC, or IANA). Optional plot-level Time window (last N seconds)
- Log scale — optional log scale on a plot’s X or Y axis. Values <= 0 are drawn below the axis. Time axes stay linear, and a log plot stays out of linked scale
- Light and dark — theme and plot-title size, weight, and color under File → Preferences. Changes apply to the open plots
-
Configs and export — File menu: open/save XML (
file://,home://,package://); import or add bags; export PNG, SVG, PDF, TXT, or CSV. Unsaved layout changes prompt on close. Older row×column files still load - Data statistics — right click on a plot to open the data statistics dialog, showing the mean, std, min, max, median, mode, range, count, RMS, and sum of the data
- Array curves — plot a whole array vs index (or vs another array field); the series is replaced on each message
-
Diagnostic messages — plot diagnostic messages from the
/diagnosticsor/diagnostics_aggtopic -
Topic metrics — plot the rate, bandwidth, and delay of a topic, as
ros2 topic hz,bw, anddelayshow them - Topic browser — browse live and bag topics, then drag’n’drop a field onto a plot
- Curve filters — ordered chain on a curve’s Y series: derivative, integral, moving average, low-pass, and others. Drag a filter onto a plot, or edit the chain in the curve dialog
- Markers — two vertical markers A and B per plot, with Δt and per-curve Δy and slope, to measure latency, rise time, or settling time
Also: run / pause / clear, circular and time-frame buffers, rad ↔ deg on an axis, grid on/off, drag-and-drop of curves between plot legends.
|
Light |
Dark |
Installation
ROS distribution
Coming soon. The package is not on the ROS build farm yet. After release:
sudo apt-get update
sudo apt-get install ros-jazzy-rqt-multiplot
sudo apt-get install ros-kilted-rqt-multiplot
sudo apt-get install ros-lyrical-rqt-multiplot
sudo apt-get install ros-rolling-rqt-multiplot
Building from source
Tested on ROS 2 Jazzy, Kilted, Lyrical, and Rolling. Put this repository in a colcon workspace src folder (clone or symlink), then:
cd ~/colcon_ws
rosdep install --from-paths src --ignore-src -y
colcon build --packages-select rqt_multiplot
source install/setup.bash
Usage
Standalone window (no rqt):
ros2 run rqt_multiplot multiplot
rqt plugin, either in its own rqt window or inside rqt (Plugins → Visualization → Multiplot):
ros2 run rqt_multiplot rqt_multiplot
rqt --force-discover
If the rqt plugin list or layout is broken:
rqt --clear-config
File truncated at 100 lines see the full file
CONTRIBUTING
Repository Summary
| Checkout URI | https://github.com/samuelba/rqt_multiplot_plugin.git |
| VCS Type | git |
| VCS Version | main |
| Last Updated | 2026-10-02 |
| Dev Status | MAINTAINED |
| Released | UNRELEASED |
| Contributing |
Help Wanted (-)
Good First Issues (-) Pull Requests to Review (-) |
Packages
| Name | Version |
|---|---|
| rqt_multiplot | 0.0.37 |
README
Rqt Multiplot Plugin
Plots numeric ROS 2 message fields in tiled 2D charts (Qwt). Nested splits and tabs give a layout that is not a strict grid. Subscribe to live topics or import a rosbag2, then inspect values with a linked cursor and a curve-values sidebar. Runs as its own window or as an rqt plugin.
Authors: Ralf Kaestner, Samuel Bachmann
Maintainer: Samuel Bachmann
License: GNU Lesser General Public License v3.0 (LGPL-3.0)
ROS2 distributions: Jazzy, Kilted, Lyrical, Rolling
Features
- Nested plot layout — split any plot left/right or top/bottom and nest splits (two on the left, one on the right). Drag splitter handles; reset the active tab to even sizes. Ratios are stored in the XML
- Tabs — multiple named layouts in one window; each tab has its own plots, colors, grid, and link/track settings
-
Live topics and rosbag2 — subscribe while running, or import
.mcap/.db3files and bag directories - Linked plots — shared scale and cursor; optional point tracking under the pointer; click a legend item to hide a curve
- Curve values — collapsible per-tab list of each curve’s latest X and Y, grouped by plot
- Time axes — message receipt time, start from zero, date-time labels, or raw stamps. Time zone in File → Preferences (local, UTC, or IANA). Optional plot-level Time window (last N seconds)
- Log scale — optional log scale on a plot’s X or Y axis. Values <= 0 are drawn below the axis. Time axes stay linear, and a log plot stays out of linked scale
- Light and dark — theme and plot-title size, weight, and color under File → Preferences. Changes apply to the open plots
-
Configs and export — File menu: open/save XML (
file://,home://,package://); import or add bags; export PNG, SVG, PDF, TXT, or CSV. Unsaved layout changes prompt on close. Older row×column files still load - Data statistics — right click on a plot to open the data statistics dialog, showing the mean, std, min, max, median, mode, range, count, RMS, and sum of the data
- Array curves — plot a whole array vs index (or vs another array field); the series is replaced on each message
-
Diagnostic messages — plot diagnostic messages from the
/diagnosticsor/diagnostics_aggtopic -
Topic metrics — plot the rate, bandwidth, and delay of a topic, as
ros2 topic hz,bw, anddelayshow them - Topic browser — browse live and bag topics, then drag’n’drop a field onto a plot
- Curve filters — ordered chain on a curve’s Y series: derivative, integral, moving average, low-pass, and others. Drag a filter onto a plot, or edit the chain in the curve dialog
- Markers — two vertical markers A and B per plot, with Δt and per-curve Δy and slope, to measure latency, rise time, or settling time
Also: run / pause / clear, circular and time-frame buffers, rad ↔ deg on an axis, grid on/off, drag-and-drop of curves between plot legends.
|
Light |
Dark |
Installation
ROS distribution
Coming soon. The package is not on the ROS build farm yet. After release:
sudo apt-get update
sudo apt-get install ros-jazzy-rqt-multiplot
sudo apt-get install ros-kilted-rqt-multiplot
sudo apt-get install ros-lyrical-rqt-multiplot
sudo apt-get install ros-rolling-rqt-multiplot
Building from source
Tested on ROS 2 Jazzy, Kilted, Lyrical, and Rolling. Put this repository in a colcon workspace src folder (clone or symlink), then:
cd ~/colcon_ws
rosdep install --from-paths src --ignore-src -y
colcon build --packages-select rqt_multiplot
source install/setup.bash
Usage
Standalone window (no rqt):
ros2 run rqt_multiplot multiplot
rqt plugin, either in its own rqt window or inside rqt (Plugins → Visualization → Multiplot):
ros2 run rqt_multiplot rqt_multiplot
rqt --force-discover
If the rqt plugin list or layout is broken:
rqt --clear-config
File truncated at 100 lines see the full file
CONTRIBUTING
Repository Summary
| Checkout URI | https://github.com/samuelba/rqt_multiplot_plugin.git |
| VCS Type | git |
| VCS Version | main |
| Last Updated | 2026-10-02 |
| Dev Status | MAINTAINED |
| Released | UNRELEASED |
| Contributing |
Help Wanted (-)
Good First Issues (-) Pull Requests to Review (-) |
Packages
| Name | Version |
|---|---|
| rqt_multiplot | 0.0.37 |
README
Rqt Multiplot Plugin
Plots numeric ROS 2 message fields in tiled 2D charts (Qwt). Nested splits and tabs give a layout that is not a strict grid. Subscribe to live topics or import a rosbag2, then inspect values with a linked cursor and a curve-values sidebar. Runs as its own window or as an rqt plugin.
Authors: Ralf Kaestner, Samuel Bachmann
Maintainer: Samuel Bachmann
License: GNU Lesser General Public License v3.0 (LGPL-3.0)
ROS2 distributions: Jazzy, Kilted, Lyrical, Rolling
Features
- Nested plot layout — split any plot left/right or top/bottom and nest splits (two on the left, one on the right). Drag splitter handles; reset the active tab to even sizes. Ratios are stored in the XML
- Tabs — multiple named layouts in one window; each tab has its own plots, colors, grid, and link/track settings
-
Live topics and rosbag2 — subscribe while running, or import
.mcap/.db3files and bag directories - Linked plots — shared scale and cursor; optional point tracking under the pointer; click a legend item to hide a curve
- Curve values — collapsible per-tab list of each curve’s latest X and Y, grouped by plot
- Time axes — message receipt time, start from zero, date-time labels, or raw stamps. Time zone in File → Preferences (local, UTC, or IANA). Optional plot-level Time window (last N seconds)
- Log scale — optional log scale on a plot’s X or Y axis. Values <= 0 are drawn below the axis. Time axes stay linear, and a log plot stays out of linked scale
- Light and dark — theme and plot-title size, weight, and color under File → Preferences. Changes apply to the open plots
-
Configs and export — File menu: open/save XML (
file://,home://,package://); import or add bags; export PNG, SVG, PDF, TXT, or CSV. Unsaved layout changes prompt on close. Older row×column files still load - Data statistics — right click on a plot to open the data statistics dialog, showing the mean, std, min, max, median, mode, range, count, RMS, and sum of the data
- Array curves — plot a whole array vs index (or vs another array field); the series is replaced on each message
-
Diagnostic messages — plot diagnostic messages from the
/diagnosticsor/diagnostics_aggtopic -
Topic metrics — plot the rate, bandwidth, and delay of a topic, as
ros2 topic hz,bw, anddelayshow them - Topic browser — browse live and bag topics, then drag’n’drop a field onto a plot
- Curve filters — ordered chain on a curve’s Y series: derivative, integral, moving average, low-pass, and others. Drag a filter onto a plot, or edit the chain in the curve dialog
- Markers — two vertical markers A and B per plot, with Δt and per-curve Δy and slope, to measure latency, rise time, or settling time
Also: run / pause / clear, circular and time-frame buffers, rad ↔ deg on an axis, grid on/off, drag-and-drop of curves between plot legends.
|
Light |
Dark |
Installation
ROS distribution
Coming soon. The package is not on the ROS build farm yet. After release:
sudo apt-get update
sudo apt-get install ros-jazzy-rqt-multiplot
sudo apt-get install ros-kilted-rqt-multiplot
sudo apt-get install ros-lyrical-rqt-multiplot
sudo apt-get install ros-rolling-rqt-multiplot
Building from source
Tested on ROS 2 Jazzy, Kilted, Lyrical, and Rolling. Put this repository in a colcon workspace src folder (clone or symlink), then:
cd ~/colcon_ws
rosdep install --from-paths src --ignore-src -y
colcon build --packages-select rqt_multiplot
source install/setup.bash
Usage
Standalone window (no rqt):
ros2 run rqt_multiplot multiplot
rqt plugin, either in its own rqt window or inside rqt (Plugins → Visualization → Multiplot):
ros2 run rqt_multiplot rqt_multiplot
rqt --force-discover
If the rqt plugin list or layout is broken:
rqt --clear-config
File truncated at 100 lines see the full file
CONTRIBUTING
Repository Summary
| Checkout URI | https://github.com/samuelba/rqt_multiplot_plugin.git |
| VCS Type | git |
| VCS Version | main |
| Last Updated | 2026-10-02 |
| Dev Status | MAINTAINED |
| Released | UNRELEASED |
| Contributing |
Help Wanted (-)
Good First Issues (-) Pull Requests to Review (-) |
Packages
| Name | Version |
|---|---|
| rqt_multiplot | 0.0.37 |
README
Rqt Multiplot Plugin
Plots numeric ROS 2 message fields in tiled 2D charts (Qwt). Nested splits and tabs give a layout that is not a strict grid. Subscribe to live topics or import a rosbag2, then inspect values with a linked cursor and a curve-values sidebar. Runs as its own window or as an rqt plugin.
Authors: Ralf Kaestner, Samuel Bachmann
Maintainer: Samuel Bachmann
License: GNU Lesser General Public License v3.0 (LGPL-3.0)
ROS2 distributions: Jazzy, Kilted, Lyrical, Rolling
Features
- Nested plot layout — split any plot left/right or top/bottom and nest splits (two on the left, one on the right). Drag splitter handles; reset the active tab to even sizes. Ratios are stored in the XML
- Tabs — multiple named layouts in one window; each tab has its own plots, colors, grid, and link/track settings
-
Live topics and rosbag2 — subscribe while running, or import
.mcap/.db3files and bag directories - Linked plots — shared scale and cursor; optional point tracking under the pointer; click a legend item to hide a curve
- Curve values — collapsible per-tab list of each curve’s latest X and Y, grouped by plot
- Time axes — message receipt time, start from zero, date-time labels, or raw stamps. Time zone in File → Preferences (local, UTC, or IANA). Optional plot-level Time window (last N seconds)
- Log scale — optional log scale on a plot’s X or Y axis. Values <= 0 are drawn below the axis. Time axes stay linear, and a log plot stays out of linked scale
- Light and dark — theme and plot-title size, weight, and color under File → Preferences. Changes apply to the open plots
-
Configs and export — File menu: open/save XML (
file://,home://,package://); import or add bags; export PNG, SVG, PDF, TXT, or CSV. Unsaved layout changes prompt on close. Older row×column files still load - Data statistics — right click on a plot to open the data statistics dialog, showing the mean, std, min, max, median, mode, range, count, RMS, and sum of the data
- Array curves — plot a whole array vs index (or vs another array field); the series is replaced on each message
-
Diagnostic messages — plot diagnostic messages from the
/diagnosticsor/diagnostics_aggtopic -
Topic metrics — plot the rate, bandwidth, and delay of a topic, as
ros2 topic hz,bw, anddelayshow them - Topic browser — browse live and bag topics, then drag’n’drop a field onto a plot
- Curve filters — ordered chain on a curve’s Y series: derivative, integral, moving average, low-pass, and others. Drag a filter onto a plot, or edit the chain in the curve dialog
- Markers — two vertical markers A and B per plot, with Δt and per-curve Δy and slope, to measure latency, rise time, or settling time
Also: run / pause / clear, circular and time-frame buffers, rad ↔ deg on an axis, grid on/off, drag-and-drop of curves between plot legends.
|
Light |
Dark |
Installation
ROS distribution
Coming soon. The package is not on the ROS build farm yet. After release:
sudo apt-get update
sudo apt-get install ros-jazzy-rqt-multiplot
sudo apt-get install ros-kilted-rqt-multiplot
sudo apt-get install ros-lyrical-rqt-multiplot
sudo apt-get install ros-rolling-rqt-multiplot
Building from source
Tested on ROS 2 Jazzy, Kilted, Lyrical, and Rolling. Put this repository in a colcon workspace src folder (clone or symlink), then:
cd ~/colcon_ws
rosdep install --from-paths src --ignore-src -y
colcon build --packages-select rqt_multiplot
source install/setup.bash
Usage
Standalone window (no rqt):
ros2 run rqt_multiplot multiplot
rqt plugin, either in its own rqt window or inside rqt (Plugins → Visualization → Multiplot):
ros2 run rqt_multiplot rqt_multiplot
rqt --force-discover
If the rqt plugin list or layout is broken:
rqt --clear-config
File truncated at 100 lines see the full file
CONTRIBUTING
Repository Summary
| Checkout URI | https://github.com/samuelba/rqt_multiplot_plugin.git |
| VCS Type | git |
| VCS Version | main |
| Last Updated | 2026-10-02 |
| Dev Status | MAINTAINED |
| Released | UNRELEASED |
| Contributing |
Help Wanted (-)
Good First Issues (-) Pull Requests to Review (-) |
Packages
| Name | Version |
|---|---|
| rqt_multiplot | 0.0.37 |
README
Rqt Multiplot Plugin
Plots numeric ROS 2 message fields in tiled 2D charts (Qwt). Nested splits and tabs give a layout that is not a strict grid. Subscribe to live topics or import a rosbag2, then inspect values with a linked cursor and a curve-values sidebar. Runs as its own window or as an rqt plugin.
Authors: Ralf Kaestner, Samuel Bachmann
Maintainer: Samuel Bachmann
License: GNU Lesser General Public License v3.0 (LGPL-3.0)
ROS2 distributions: Jazzy, Kilted, Lyrical, Rolling
Features
- Nested plot layout — split any plot left/right or top/bottom and nest splits (two on the left, one on the right). Drag splitter handles; reset the active tab to even sizes. Ratios are stored in the XML
- Tabs — multiple named layouts in one window; each tab has its own plots, colors, grid, and link/track settings
-
Live topics and rosbag2 — subscribe while running, or import
.mcap/.db3files and bag directories - Linked plots — shared scale and cursor; optional point tracking under the pointer; click a legend item to hide a curve
- Curve values — collapsible per-tab list of each curve’s latest X and Y, grouped by plot
- Time axes — message receipt time, start from zero, date-time labels, or raw stamps. Time zone in File → Preferences (local, UTC, or IANA). Optional plot-level Time window (last N seconds)
- Log scale — optional log scale on a plot’s X or Y axis. Values <= 0 are drawn below the axis. Time axes stay linear, and a log plot stays out of linked scale
- Light and dark — theme and plot-title size, weight, and color under File → Preferences. Changes apply to the open plots
-
Configs and export — File menu: open/save XML (
file://,home://,package://); import or add bags; export PNG, SVG, PDF, TXT, or CSV. Unsaved layout changes prompt on close. Older row×column files still load - Data statistics — right click on a plot to open the data statistics dialog, showing the mean, std, min, max, median, mode, range, count, RMS, and sum of the data
- Array curves — plot a whole array vs index (or vs another array field); the series is replaced on each message
-
Diagnostic messages — plot diagnostic messages from the
/diagnosticsor/diagnostics_aggtopic -
Topic metrics — plot the rate, bandwidth, and delay of a topic, as
ros2 topic hz,bw, anddelayshow them - Topic browser — browse live and bag topics, then drag’n’drop a field onto a plot
- Curve filters — ordered chain on a curve’s Y series: derivative, integral, moving average, low-pass, and others. Drag a filter onto a plot, or edit the chain in the curve dialog
- Markers — two vertical markers A and B per plot, with Δt and per-curve Δy and slope, to measure latency, rise time, or settling time
Also: run / pause / clear, circular and time-frame buffers, rad ↔ deg on an axis, grid on/off, drag-and-drop of curves between plot legends.
|
Light |
Dark |
Installation
ROS distribution
Coming soon. The package is not on the ROS build farm yet. After release:
sudo apt-get update
sudo apt-get install ros-jazzy-rqt-multiplot
sudo apt-get install ros-kilted-rqt-multiplot
sudo apt-get install ros-lyrical-rqt-multiplot
sudo apt-get install ros-rolling-rqt-multiplot
Building from source
Tested on ROS 2 Jazzy, Kilted, Lyrical, and Rolling. Put this repository in a colcon workspace src folder (clone or symlink), then:
cd ~/colcon_ws
rosdep install --from-paths src --ignore-src -y
colcon build --packages-select rqt_multiplot
source install/setup.bash
Usage
Standalone window (no rqt):
ros2 run rqt_multiplot multiplot
rqt plugin, either in its own rqt window or inside rqt (Plugins → Visualization → Multiplot):
ros2 run rqt_multiplot rqt_multiplot
rqt --force-discover
If the rqt plugin list or layout is broken:
rqt --clear-config
File truncated at 100 lines see the full file
CONTRIBUTING
Repository Summary
| Checkout URI | https://github.com/samuelba/rqt_multiplot_plugin.git |
| VCS Type | git |
| VCS Version | main |
| Last Updated | 2026-10-02 |
| Dev Status | MAINTAINED |
| Released | UNRELEASED |
| Contributing |
Help Wanted (-)
Good First Issues (-) Pull Requests to Review (-) |
Packages
| Name | Version |
|---|---|
| rqt_multiplot | 0.0.37 |
README
Rqt Multiplot Plugin
Plots numeric ROS 2 message fields in tiled 2D charts (Qwt). Nested splits and tabs give a layout that is not a strict grid. Subscribe to live topics or import a rosbag2, then inspect values with a linked cursor and a curve-values sidebar. Runs as its own window or as an rqt plugin.
Authors: Ralf Kaestner, Samuel Bachmann
Maintainer: Samuel Bachmann
License: GNU Lesser General Public License v3.0 (LGPL-3.0)
ROS2 distributions: Jazzy, Kilted, Lyrical, Rolling
Features
- Nested plot layout — split any plot left/right or top/bottom and nest splits (two on the left, one on the right). Drag splitter handles; reset the active tab to even sizes. Ratios are stored in the XML
- Tabs — multiple named layouts in one window; each tab has its own plots, colors, grid, and link/track settings
-
Live topics and rosbag2 — subscribe while running, or import
.mcap/.db3files and bag directories - Linked plots — shared scale and cursor; optional point tracking under the pointer; click a legend item to hide a curve
- Curve values — collapsible per-tab list of each curve’s latest X and Y, grouped by plot
- Time axes — message receipt time, start from zero, date-time labels, or raw stamps. Time zone in File → Preferences (local, UTC, or IANA). Optional plot-level Time window (last N seconds)
- Log scale — optional log scale on a plot’s X or Y axis. Values <= 0 are drawn below the axis. Time axes stay linear, and a log plot stays out of linked scale
- Light and dark — theme and plot-title size, weight, and color under File → Preferences. Changes apply to the open plots
-
Configs and export — File menu: open/save XML (
file://,home://,package://); import or add bags; export PNG, SVG, PDF, TXT, or CSV. Unsaved layout changes prompt on close. Older row×column files still load - Data statistics — right click on a plot to open the data statistics dialog, showing the mean, std, min, max, median, mode, range, count, RMS, and sum of the data
- Array curves — plot a whole array vs index (or vs another array field); the series is replaced on each message
-
Diagnostic messages — plot diagnostic messages from the
/diagnosticsor/diagnostics_aggtopic -
Topic metrics — plot the rate, bandwidth, and delay of a topic, as
ros2 topic hz,bw, anddelayshow them - Topic browser — browse live and bag topics, then drag’n’drop a field onto a plot
- Curve filters — ordered chain on a curve’s Y series: derivative, integral, moving average, low-pass, and others. Drag a filter onto a plot, or edit the chain in the curve dialog
- Markers — two vertical markers A and B per plot, with Δt and per-curve Δy and slope, to measure latency, rise time, or settling time
Also: run / pause / clear, circular and time-frame buffers, rad ↔ deg on an axis, grid on/off, drag-and-drop of curves between plot legends.
|
Light |
Dark |
Installation
ROS distribution
Coming soon. The package is not on the ROS build farm yet. After release:
sudo apt-get update
sudo apt-get install ros-jazzy-rqt-multiplot
sudo apt-get install ros-kilted-rqt-multiplot
sudo apt-get install ros-lyrical-rqt-multiplot
sudo apt-get install ros-rolling-rqt-multiplot
Building from source
Tested on ROS 2 Jazzy, Kilted, Lyrical, and Rolling. Put this repository in a colcon workspace src folder (clone or symlink), then:
cd ~/colcon_ws
rosdep install --from-paths src --ignore-src -y
colcon build --packages-select rqt_multiplot
source install/setup.bash
Usage
Standalone window (no rqt):
ros2 run rqt_multiplot multiplot
rqt plugin, either in its own rqt window or inside rqt (Plugins → Visualization → Multiplot):
ros2 run rqt_multiplot rqt_multiplot
rqt --force-discover
If the rqt plugin list or layout is broken:
rqt --clear-config
File truncated at 100 lines see the full file
CONTRIBUTING
Repository Summary
| Checkout URI | https://github.com/samuelba/rqt_multiplot_plugin.git |
| VCS Type | git |
| VCS Version | main |
| Last Updated | 2026-10-02 |
| Dev Status | MAINTAINED |
| Released | UNRELEASED |
| Contributing |
Help Wanted (-)
Good First Issues (-) Pull Requests to Review (-) |
Packages
| Name | Version |
|---|---|
| rqt_multiplot | 0.0.37 |
README
Rqt Multiplot Plugin
Plots numeric ROS 2 message fields in tiled 2D charts (Qwt). Nested splits and tabs give a layout that is not a strict grid. Subscribe to live topics or import a rosbag2, then inspect values with a linked cursor and a curve-values sidebar. Runs as its own window or as an rqt plugin.
Authors: Ralf Kaestner, Samuel Bachmann
Maintainer: Samuel Bachmann
License: GNU Lesser General Public License v3.0 (LGPL-3.0)
ROS2 distributions: Jazzy, Kilted, Lyrical, Rolling
Features
- Nested plot layout — split any plot left/right or top/bottom and nest splits (two on the left, one on the right). Drag splitter handles; reset the active tab to even sizes. Ratios are stored in the XML
- Tabs — multiple named layouts in one window; each tab has its own plots, colors, grid, and link/track settings
-
Live topics and rosbag2 — subscribe while running, or import
.mcap/.db3files and bag directories - Linked plots — shared scale and cursor; optional point tracking under the pointer; click a legend item to hide a curve
- Curve values — collapsible per-tab list of each curve’s latest X and Y, grouped by plot
- Time axes — message receipt time, start from zero, date-time labels, or raw stamps. Time zone in File → Preferences (local, UTC, or IANA). Optional plot-level Time window (last N seconds)
- Log scale — optional log scale on a plot’s X or Y axis. Values <= 0 are drawn below the axis. Time axes stay linear, and a log plot stays out of linked scale
- Light and dark — theme and plot-title size, weight, and color under File → Preferences. Changes apply to the open plots
-
Configs and export — File menu: open/save XML (
file://,home://,package://); import or add bags; export PNG, SVG, PDF, TXT, or CSV. Unsaved layout changes prompt on close. Older row×column files still load - Data statistics — right click on a plot to open the data statistics dialog, showing the mean, std, min, max, median, mode, range, count, RMS, and sum of the data
- Array curves — plot a whole array vs index (or vs another array field); the series is replaced on each message
-
Diagnostic messages — plot diagnostic messages from the
/diagnosticsor/diagnostics_aggtopic -
Topic metrics — plot the rate, bandwidth, and delay of a topic, as
ros2 topic hz,bw, anddelayshow them - Topic browser — browse live and bag topics, then drag’n’drop a field onto a plot
- Curve filters — ordered chain on a curve’s Y series: derivative, integral, moving average, low-pass, and others. Drag a filter onto a plot, or edit the chain in the curve dialog
- Markers — two vertical markers A and B per plot, with Δt and per-curve Δy and slope, to measure latency, rise time, or settling time
Also: run / pause / clear, circular and time-frame buffers, rad ↔ deg on an axis, grid on/off, drag-and-drop of curves between plot legends.
|
Light |
Dark |
Installation
ROS distribution
Coming soon. The package is not on the ROS build farm yet. After release:
sudo apt-get update
sudo apt-get install ros-jazzy-rqt-multiplot
sudo apt-get install ros-kilted-rqt-multiplot
sudo apt-get install ros-lyrical-rqt-multiplot
sudo apt-get install ros-rolling-rqt-multiplot
Building from source
Tested on ROS 2 Jazzy, Kilted, Lyrical, and Rolling. Put this repository in a colcon workspace src folder (clone or symlink), then:
cd ~/colcon_ws
rosdep install --from-paths src --ignore-src -y
colcon build --packages-select rqt_multiplot
source install/setup.bash
Usage
Standalone window (no rqt):
ros2 run rqt_multiplot multiplot
rqt plugin, either in its own rqt window or inside rqt (Plugins → Visualization → Multiplot):
ros2 run rqt_multiplot rqt_multiplot
rqt --force-discover
If the rqt plugin list or layout is broken:
rqt --clear-config
File truncated at 100 lines see the full file
CONTRIBUTING
Repository Summary
| Checkout URI | https://github.com/samuelba/rqt_multiplot_plugin.git |
| VCS Type | git |
| VCS Version | main |
| Last Updated | 2026-10-02 |
| Dev Status | MAINTAINED |
| Released | UNRELEASED |
| Contributing |
Help Wanted (-)
Good First Issues (-) Pull Requests to Review (-) |
Packages
| Name | Version |
|---|---|
| rqt_multiplot | 0.0.37 |
README
Rqt Multiplot Plugin
Plots numeric ROS 2 message fields in tiled 2D charts (Qwt). Nested splits and tabs give a layout that is not a strict grid. Subscribe to live topics or import a rosbag2, then inspect values with a linked cursor and a curve-values sidebar. Runs as its own window or as an rqt plugin.
Authors: Ralf Kaestner, Samuel Bachmann
Maintainer: Samuel Bachmann
License: GNU Lesser General Public License v3.0 (LGPL-3.0)
ROS2 distributions: Jazzy, Kilted, Lyrical, Rolling
Features
- Nested plot layout — split any plot left/right or top/bottom and nest splits (two on the left, one on the right). Drag splitter handles; reset the active tab to even sizes. Ratios are stored in the XML
- Tabs — multiple named layouts in one window; each tab has its own plots, colors, grid, and link/track settings
-
Live topics and rosbag2 — subscribe while running, or import
.mcap/.db3files and bag directories - Linked plots — shared scale and cursor; optional point tracking under the pointer; click a legend item to hide a curve
- Curve values — collapsible per-tab list of each curve’s latest X and Y, grouped by plot
- Time axes — message receipt time, start from zero, date-time labels, or raw stamps. Time zone in File → Preferences (local, UTC, or IANA). Optional plot-level Time window (last N seconds)
- Log scale — optional log scale on a plot’s X or Y axis. Values <= 0 are drawn below the axis. Time axes stay linear, and a log plot stays out of linked scale
- Light and dark — theme and plot-title size, weight, and color under File → Preferences. Changes apply to the open plots
-
Configs and export — File menu: open/save XML (
file://,home://,package://); import or add bags; export PNG, SVG, PDF, TXT, or CSV. Unsaved layout changes prompt on close. Older row×column files still load - Data statistics — right click on a plot to open the data statistics dialog, showing the mean, std, min, max, median, mode, range, count, RMS, and sum of the data
- Array curves — plot a whole array vs index (or vs another array field); the series is replaced on each message
-
Diagnostic messages — plot diagnostic messages from the
/diagnosticsor/diagnostics_aggtopic -
Topic metrics — plot the rate, bandwidth, and delay of a topic, as
ros2 topic hz,bw, anddelayshow them - Topic browser — browse live and bag topics, then drag’n’drop a field onto a plot
- Curve filters — ordered chain on a curve’s Y series: derivative, integral, moving average, low-pass, and others. Drag a filter onto a plot, or edit the chain in the curve dialog
- Markers — two vertical markers A and B per plot, with Δt and per-curve Δy and slope, to measure latency, rise time, or settling time
Also: run / pause / clear, circular and time-frame buffers, rad ↔ deg on an axis, grid on/off, drag-and-drop of curves between plot legends.
|
Light |
Dark |
Installation
ROS distribution
Coming soon. The package is not on the ROS build farm yet. After release:
sudo apt-get update
sudo apt-get install ros-jazzy-rqt-multiplot
sudo apt-get install ros-kilted-rqt-multiplot
sudo apt-get install ros-lyrical-rqt-multiplot
sudo apt-get install ros-rolling-rqt-multiplot
Building from source
Tested on ROS 2 Jazzy, Kilted, Lyrical, and Rolling. Put this repository in a colcon workspace src folder (clone or symlink), then:
cd ~/colcon_ws
rosdep install --from-paths src --ignore-src -y
colcon build --packages-select rqt_multiplot
source install/setup.bash
Usage
Standalone window (no rqt):
ros2 run rqt_multiplot multiplot
rqt plugin, either in its own rqt window or inside rqt (Plugins → Visualization → Multiplot):
ros2 run rqt_multiplot rqt_multiplot
rqt --force-discover
If the rqt plugin list or layout is broken:
rqt --clear-config
File truncated at 100 lines see the full file
CONTRIBUTING
Repository Summary
| Checkout URI | https://github.com/samuelba/rqt_multiplot_plugin.git |
| VCS Type | git |
| VCS Version | main |
| Last Updated | 2026-10-02 |
| Dev Status | MAINTAINED |
| Released | UNRELEASED |
| Contributing |
Help Wanted (-)
Good First Issues (-) Pull Requests to Review (-) |
Packages
| Name | Version |
|---|---|
| rqt_multiplot | 0.0.37 |
README
Rqt Multiplot Plugin
Plots numeric ROS 2 message fields in tiled 2D charts (Qwt). Nested splits and tabs give a layout that is not a strict grid. Subscribe to live topics or import a rosbag2, then inspect values with a linked cursor and a curve-values sidebar. Runs as its own window or as an rqt plugin.
Authors: Ralf Kaestner, Samuel Bachmann
Maintainer: Samuel Bachmann
License: GNU Lesser General Public License v3.0 (LGPL-3.0)
ROS2 distributions: Jazzy, Kilted, Lyrical, Rolling
Features
- Nested plot layout — split any plot left/right or top/bottom and nest splits (two on the left, one on the right). Drag splitter handles; reset the active tab to even sizes. Ratios are stored in the XML
- Tabs — multiple named layouts in one window; each tab has its own plots, colors, grid, and link/track settings
-
Live topics and rosbag2 — subscribe while running, or import
.mcap/.db3files and bag directories - Linked plots — shared scale and cursor; optional point tracking under the pointer; click a legend item to hide a curve
- Curve values — collapsible per-tab list of each curve’s latest X and Y, grouped by plot
- Time axes — message receipt time, start from zero, date-time labels, or raw stamps. Time zone in File → Preferences (local, UTC, or IANA). Optional plot-level Time window (last N seconds)
- Log scale — optional log scale on a plot’s X or Y axis. Values <= 0 are drawn below the axis. Time axes stay linear, and a log plot stays out of linked scale
- Light and dark — theme and plot-title size, weight, and color under File → Preferences. Changes apply to the open plots
-
Configs and export — File menu: open/save XML (
file://,home://,package://); import or add bags; export PNG, SVG, PDF, TXT, or CSV. Unsaved layout changes prompt on close. Older row×column files still load - Data statistics — right click on a plot to open the data statistics dialog, showing the mean, std, min, max, median, mode, range, count, RMS, and sum of the data
- Array curves — plot a whole array vs index (or vs another array field); the series is replaced on each message
-
Diagnostic messages — plot diagnostic messages from the
/diagnosticsor/diagnostics_aggtopic -
Topic metrics — plot the rate, bandwidth, and delay of a topic, as
ros2 topic hz,bw, anddelayshow them - Topic browser — browse live and bag topics, then drag’n’drop a field onto a plot
- Curve filters — ordered chain on a curve’s Y series: derivative, integral, moving average, low-pass, and others. Drag a filter onto a plot, or edit the chain in the curve dialog
- Markers — two vertical markers A and B per plot, with Δt and per-curve Δy and slope, to measure latency, rise time, or settling time
Also: run / pause / clear, circular and time-frame buffers, rad ↔ deg on an axis, grid on/off, drag-and-drop of curves between plot legends.
|
Light |
Dark |
Installation
ROS distribution
Coming soon. The package is not on the ROS build farm yet. After release:
sudo apt-get update
sudo apt-get install ros-jazzy-rqt-multiplot
sudo apt-get install ros-kilted-rqt-multiplot
sudo apt-get install ros-lyrical-rqt-multiplot
sudo apt-get install ros-rolling-rqt-multiplot
Building from source
Tested on ROS 2 Jazzy, Kilted, Lyrical, and Rolling. Put this repository in a colcon workspace src folder (clone or symlink), then:
cd ~/colcon_ws
rosdep install --from-paths src --ignore-src -y
colcon build --packages-select rqt_multiplot
source install/setup.bash
Usage
Standalone window (no rqt):
ros2 run rqt_multiplot multiplot
rqt plugin, either in its own rqt window or inside rqt (Plugins → Visualization → Multiplot):
ros2 run rqt_multiplot rqt_multiplot
rqt --force-discover
If the rqt plugin list or layout is broken:
rqt --clear-config
File truncated at 100 lines see the full file
CONTRIBUTING
Repository Summary
| Checkout URI | https://github.com/samuelba/rqt_multiplot_plugin.git |
| VCS Type | git |
| VCS Version | main |
| Last Updated | 2026-10-02 |
| Dev Status | MAINTAINED |
| Released | UNRELEASED |
| Contributing |
Help Wanted (-)
Good First Issues (-) Pull Requests to Review (-) |
Packages
| Name | Version |
|---|---|
| rqt_multiplot | 0.0.37 |
README
Rqt Multiplot Plugin
Plots numeric ROS 2 message fields in tiled 2D charts (Qwt). Nested splits and tabs give a layout that is not a strict grid. Subscribe to live topics or import a rosbag2, then inspect values with a linked cursor and a curve-values sidebar. Runs as its own window or as an rqt plugin.
Authors: Ralf Kaestner, Samuel Bachmann
Maintainer: Samuel Bachmann
License: GNU Lesser General Public License v3.0 (LGPL-3.0)
ROS2 distributions: Jazzy, Kilted, Lyrical, Rolling
Features
- Nested plot layout — split any plot left/right or top/bottom and nest splits (two on the left, one on the right). Drag splitter handles; reset the active tab to even sizes. Ratios are stored in the XML
- Tabs — multiple named layouts in one window; each tab has its own plots, colors, grid, and link/track settings
-
Live topics and rosbag2 — subscribe while running, or import
.mcap/.db3files and bag directories - Linked plots — shared scale and cursor; optional point tracking under the pointer; click a legend item to hide a curve
- Curve values — collapsible per-tab list of each curve’s latest X and Y, grouped by plot
- Time axes — message receipt time, start from zero, date-time labels, or raw stamps. Time zone in File → Preferences (local, UTC, or IANA). Optional plot-level Time window (last N seconds)
- Log scale — optional log scale on a plot’s X or Y axis. Values <= 0 are drawn below the axis. Time axes stay linear, and a log plot stays out of linked scale
- Light and dark — theme and plot-title size, weight, and color under File → Preferences. Changes apply to the open plots
-
Configs and export — File menu: open/save XML (
file://,home://,package://); import or add bags; export PNG, SVG, PDF, TXT, or CSV. Unsaved layout changes prompt on close. Older row×column files still load - Data statistics — right click on a plot to open the data statistics dialog, showing the mean, std, min, max, median, mode, range, count, RMS, and sum of the data
- Array curves — plot a whole array vs index (or vs another array field); the series is replaced on each message
-
Diagnostic messages — plot diagnostic messages from the
/diagnosticsor/diagnostics_aggtopic -
Topic metrics — plot the rate, bandwidth, and delay of a topic, as
ros2 topic hz,bw, anddelayshow them - Topic browser — browse live and bag topics, then drag’n’drop a field onto a plot
- Curve filters — ordered chain on a curve’s Y series: derivative, integral, moving average, low-pass, and others. Drag a filter onto a plot, or edit the chain in the curve dialog
- Markers — two vertical markers A and B per plot, with Δt and per-curve Δy and slope, to measure latency, rise time, or settling time
Also: run / pause / clear, circular and time-frame buffers, rad ↔ deg on an axis, grid on/off, drag-and-drop of curves between plot legends.
|
Light |
Dark |
Installation
ROS distribution
Coming soon. The package is not on the ROS build farm yet. After release:
sudo apt-get update
sudo apt-get install ros-jazzy-rqt-multiplot
sudo apt-get install ros-kilted-rqt-multiplot
sudo apt-get install ros-lyrical-rqt-multiplot
sudo apt-get install ros-rolling-rqt-multiplot
Building from source
Tested on ROS 2 Jazzy, Kilted, Lyrical, and Rolling. Put this repository in a colcon workspace src folder (clone or symlink), then:
cd ~/colcon_ws
rosdep install --from-paths src --ignore-src -y
colcon build --packages-select rqt_multiplot
source install/setup.bash
Usage
Standalone window (no rqt):
ros2 run rqt_multiplot multiplot
rqt plugin, either in its own rqt window or inside rqt (Plugins → Visualization → Multiplot):
ros2 run rqt_multiplot rqt_multiplot
rqt --force-discover
If the rqt plugin list or layout is broken:
rqt --clear-config
File truncated at 100 lines see the full file
CONTRIBUTING
Repository Summary
| Checkout URI | https://github.com/samuelba/rqt_multiplot_plugin.git |
| VCS Type | git |
| VCS Version | main |
| Last Updated | 2026-10-02 |
| Dev Status | MAINTAINED |
| Released | UNRELEASED |
| Contributing |
Help Wanted (-)
Good First Issues (-) Pull Requests to Review (-) |
Packages
| Name | Version |
|---|---|
| rqt_multiplot | 0.0.37 |
README
Rqt Multiplot Plugin
Plots numeric ROS 2 message fields in tiled 2D charts (Qwt). Nested splits and tabs give a layout that is not a strict grid. Subscribe to live topics or import a rosbag2, then inspect values with a linked cursor and a curve-values sidebar. Runs as its own window or as an rqt plugin.
Authors: Ralf Kaestner, Samuel Bachmann
Maintainer: Samuel Bachmann
License: GNU Lesser General Public License v3.0 (LGPL-3.0)
ROS2 distributions: Jazzy, Kilted, Lyrical, Rolling
Features
- Nested plot layout — split any plot left/right or top/bottom and nest splits (two on the left, one on the right). Drag splitter handles; reset the active tab to even sizes. Ratios are stored in the XML
- Tabs — multiple named layouts in one window; each tab has its own plots, colors, grid, and link/track settings
-
Live topics and rosbag2 — subscribe while running, or import
.mcap/.db3files and bag directories - Linked plots — shared scale and cursor; optional point tracking under the pointer; click a legend item to hide a curve
- Curve values — collapsible per-tab list of each curve’s latest X and Y, grouped by plot
- Time axes — message receipt time, start from zero, date-time labels, or raw stamps. Time zone in File → Preferences (local, UTC, or IANA). Optional plot-level Time window (last N seconds)
- Log scale — optional log scale on a plot’s X or Y axis. Values <= 0 are drawn below the axis. Time axes stay linear, and a log plot stays out of linked scale
- Light and dark — theme and plot-title size, weight, and color under File → Preferences. Changes apply to the open plots
-
Configs and export — File menu: open/save XML (
file://,home://,package://); import or add bags; export PNG, SVG, PDF, TXT, or CSV. Unsaved layout changes prompt on close. Older row×column files still load - Data statistics — right click on a plot to open the data statistics dialog, showing the mean, std, min, max, median, mode, range, count, RMS, and sum of the data
- Array curves — plot a whole array vs index (or vs another array field); the series is replaced on each message
-
Diagnostic messages — plot diagnostic messages from the
/diagnosticsor/diagnostics_aggtopic -
Topic metrics — plot the rate, bandwidth, and delay of a topic, as
ros2 topic hz,bw, anddelayshow them - Topic browser — browse live and bag topics, then drag’n’drop a field onto a plot
- Curve filters — ordered chain on a curve’s Y series: derivative, integral, moving average, low-pass, and others. Drag a filter onto a plot, or edit the chain in the curve dialog
- Markers — two vertical markers A and B per plot, with Δt and per-curve Δy and slope, to measure latency, rise time, or settling time
Also: run / pause / clear, circular and time-frame buffers, rad ↔ deg on an axis, grid on/off, drag-and-drop of curves between plot legends.
|
Light |
Dark |
Installation
ROS distribution
Coming soon. The package is not on the ROS build farm yet. After release:
sudo apt-get update
sudo apt-get install ros-jazzy-rqt-multiplot
sudo apt-get install ros-kilted-rqt-multiplot
sudo apt-get install ros-lyrical-rqt-multiplot
sudo apt-get install ros-rolling-rqt-multiplot
Building from source
Tested on ROS 2 Jazzy, Kilted, Lyrical, and Rolling. Put this repository in a colcon workspace src folder (clone or symlink), then:
cd ~/colcon_ws
rosdep install --from-paths src --ignore-src -y
colcon build --packages-select rqt_multiplot
source install/setup.bash
Usage
Standalone window (no rqt):
ros2 run rqt_multiplot multiplot
rqt plugin, either in its own rqt window or inside rqt (Plugins → Visualization → Multiplot):
ros2 run rqt_multiplot rqt_multiplot
rqt --force-discover
If the rqt plugin list or layout is broken:
rqt --clear-config
File truncated at 100 lines see the full file
CONTRIBUTING
Repository Summary
| Checkout URI | https://github.com/samuelba/rqt_multiplot_plugin.git |
| VCS Type | git |
| VCS Version | main |
| Last Updated | 2026-10-02 |
| Dev Status | MAINTAINED |
| Released | UNRELEASED |
| Contributing |
Help Wanted (-)
Good First Issues (-) Pull Requests to Review (-) |
Packages
| Name | Version |
|---|---|
| rqt_multiplot | 0.0.37 |
README
Rqt Multiplot Plugin
Plots numeric ROS 2 message fields in tiled 2D charts (Qwt). Nested splits and tabs give a layout that is not a strict grid. Subscribe to live topics or import a rosbag2, then inspect values with a linked cursor and a curve-values sidebar. Runs as its own window or as an rqt plugin.
Authors: Ralf Kaestner, Samuel Bachmann
Maintainer: Samuel Bachmann
License: GNU Lesser General Public License v3.0 (LGPL-3.0)
ROS2 distributions: Jazzy, Kilted, Lyrical, Rolling
Features
- Nested plot layout — split any plot left/right or top/bottom and nest splits (two on the left, one on the right). Drag splitter handles; reset the active tab to even sizes. Ratios are stored in the XML
- Tabs — multiple named layouts in one window; each tab has its own plots, colors, grid, and link/track settings
-
Live topics and rosbag2 — subscribe while running, or import
.mcap/.db3files and bag directories - Linked plots — shared scale and cursor; optional point tracking under the pointer; click a legend item to hide a curve
- Curve values — collapsible per-tab list of each curve’s latest X and Y, grouped by plot
- Time axes — message receipt time, start from zero, date-time labels, or raw stamps. Time zone in File → Preferences (local, UTC, or IANA). Optional plot-level Time window (last N seconds)
- Log scale — optional log scale on a plot’s X or Y axis. Values <= 0 are drawn below the axis. Time axes stay linear, and a log plot stays out of linked scale
- Light and dark — theme and plot-title size, weight, and color under File → Preferences. Changes apply to the open plots
-
Configs and export — File menu: open/save XML (
file://,home://,package://); import or add bags; export PNG, SVG, PDF, TXT, or CSV. Unsaved layout changes prompt on close. Older row×column files still load - Data statistics — right click on a plot to open the data statistics dialog, showing the mean, std, min, max, median, mode, range, count, RMS, and sum of the data
- Array curves — plot a whole array vs index (or vs another array field); the series is replaced on each message
-
Diagnostic messages — plot diagnostic messages from the
/diagnosticsor/diagnostics_aggtopic -
Topic metrics — plot the rate, bandwidth, and delay of a topic, as
ros2 topic hz,bw, anddelayshow them - Topic browser — browse live and bag topics, then drag’n’drop a field onto a plot
- Curve filters — ordered chain on a curve’s Y series: derivative, integral, moving average, low-pass, and others. Drag a filter onto a plot, or edit the chain in the curve dialog
- Markers — two vertical markers A and B per plot, with Δt and per-curve Δy and slope, to measure latency, rise time, or settling time
Also: run / pause / clear, circular and time-frame buffers, rad ↔ deg on an axis, grid on/off, drag-and-drop of curves between plot legends.
|
Light |
Dark |
Installation
ROS distribution
Coming soon. The package is not on the ROS build farm yet. After release:
sudo apt-get update
sudo apt-get install ros-jazzy-rqt-multiplot
sudo apt-get install ros-kilted-rqt-multiplot
sudo apt-get install ros-lyrical-rqt-multiplot
sudo apt-get install ros-rolling-rqt-multiplot
Building from source
Tested on ROS 2 Jazzy, Kilted, Lyrical, and Rolling. Put this repository in a colcon workspace src folder (clone or symlink), then:
cd ~/colcon_ws
rosdep install --from-paths src --ignore-src -y
colcon build --packages-select rqt_multiplot
source install/setup.bash
Usage
Standalone window (no rqt):
ros2 run rqt_multiplot multiplot
rqt plugin, either in its own rqt window or inside rqt (Plugins → Visualization → Multiplot):
ros2 run rqt_multiplot rqt_multiplot
rqt --force-discover
If the rqt plugin list or layout is broken:
rqt --clear-config
File truncated at 100 lines see the full file
CONTRIBUTING
Repository Summary
| Checkout URI | https://github.com/samuelba/rqt_multiplot_plugin.git |
| VCS Type | git |
| VCS Version | main |
| Last Updated | 2026-10-02 |
| Dev Status | MAINTAINED |
| Released | UNRELEASED |
| Contributing |
Help Wanted (-)
Good First Issues (-) Pull Requests to Review (-) |
Packages
| Name | Version |
|---|---|
| rqt_multiplot | 0.0.37 |
README
Rqt Multiplot Plugin
Plots numeric ROS 2 message fields in tiled 2D charts (Qwt). Nested splits and tabs give a layout that is not a strict grid. Subscribe to live topics or import a rosbag2, then inspect values with a linked cursor and a curve-values sidebar. Runs as its own window or as an rqt plugin.
Authors: Ralf Kaestner, Samuel Bachmann
Maintainer: Samuel Bachmann
License: GNU Lesser General Public License v3.0 (LGPL-3.0)
ROS2 distributions: Jazzy, Kilted, Lyrical, Rolling
Features
- Nested plot layout — split any plot left/right or top/bottom and nest splits (two on the left, one on the right). Drag splitter handles; reset the active tab to even sizes. Ratios are stored in the XML
- Tabs — multiple named layouts in one window; each tab has its own plots, colors, grid, and link/track settings
-
Live topics and rosbag2 — subscribe while running, or import
.mcap/.db3files and bag directories - Linked plots — shared scale and cursor; optional point tracking under the pointer; click a legend item to hide a curve
- Curve values — collapsible per-tab list of each curve’s latest X and Y, grouped by plot
- Time axes — message receipt time, start from zero, date-time labels, or raw stamps. Time zone in File → Preferences (local, UTC, or IANA). Optional plot-level Time window (last N seconds)
- Log scale — optional log scale on a plot’s X or Y axis. Values <= 0 are drawn below the axis. Time axes stay linear, and a log plot stays out of linked scale
- Light and dark — theme and plot-title size, weight, and color under File → Preferences. Changes apply to the open plots
-
Configs and export — File menu: open/save XML (
file://,home://,package://); import or add bags; export PNG, SVG, PDF, TXT, or CSV. Unsaved layout changes prompt on close. Older row×column files still load - Data statistics — right click on a plot to open the data statistics dialog, showing the mean, std, min, max, median, mode, range, count, RMS, and sum of the data
- Array curves — plot a whole array vs index (or vs another array field); the series is replaced on each message
-
Diagnostic messages — plot diagnostic messages from the
/diagnosticsor/diagnostics_aggtopic -
Topic metrics — plot the rate, bandwidth, and delay of a topic, as
ros2 topic hz,bw, anddelayshow them - Topic browser — browse live and bag topics, then drag’n’drop a field onto a plot
- Curve filters — ordered chain on a curve’s Y series: derivative, integral, moving average, low-pass, and others. Drag a filter onto a plot, or edit the chain in the curve dialog
- Markers — two vertical markers A and B per plot, with Δt and per-curve Δy and slope, to measure latency, rise time, or settling time
Also: run / pause / clear, circular and time-frame buffers, rad ↔ deg on an axis, grid on/off, drag-and-drop of curves between plot legends.
|
Light |
Dark |
Installation
ROS distribution
Coming soon. The package is not on the ROS build farm yet. After release:
sudo apt-get update
sudo apt-get install ros-jazzy-rqt-multiplot
sudo apt-get install ros-kilted-rqt-multiplot
sudo apt-get install ros-lyrical-rqt-multiplot
sudo apt-get install ros-rolling-rqt-multiplot
Building from source
Tested on ROS 2 Jazzy, Kilted, Lyrical, and Rolling. Put this repository in a colcon workspace src folder (clone or symlink), then:
cd ~/colcon_ws
rosdep install --from-paths src --ignore-src -y
colcon build --packages-select rqt_multiplot
source install/setup.bash
Usage
Standalone window (no rqt):
ros2 run rqt_multiplot multiplot
rqt plugin, either in its own rqt window or inside rqt (Plugins → Visualization → Multiplot):
ros2 run rqt_multiplot rqt_multiplot
rqt --force-discover
If the rqt plugin list or layout is broken:
rqt --clear-config
File truncated at 100 lines see the full file
CONTRIBUTING
Repository Summary
| Checkout URI | https://github.com/samuelba/rqt_multiplot_plugin.git |
| VCS Type | git |
| VCS Version | main |
| Last Updated | 2026-10-02 |
| Dev Status | MAINTAINED |
| Released | UNRELEASED |
| Contributing |
Help Wanted (-)
Good First Issues (-) Pull Requests to Review (-) |
Packages
| Name | Version |
|---|---|
| rqt_multiplot | 0.0.37 |
README
Rqt Multiplot Plugin
Plots numeric ROS 2 message fields in tiled 2D charts (Qwt). Nested splits and tabs give a layout that is not a strict grid. Subscribe to live topics or import a rosbag2, then inspect values with a linked cursor and a curve-values sidebar. Runs as its own window or as an rqt plugin.
Authors: Ralf Kaestner, Samuel Bachmann
Maintainer: Samuel Bachmann
License: GNU Lesser General Public License v3.0 (LGPL-3.0)
ROS2 distributions: Jazzy, Kilted, Lyrical, Rolling
Features
- Nested plot layout — split any plot left/right or top/bottom and nest splits (two on the left, one on the right). Drag splitter handles; reset the active tab to even sizes. Ratios are stored in the XML
- Tabs — multiple named layouts in one window; each tab has its own plots, colors, grid, and link/track settings
-
Live topics and rosbag2 — subscribe while running, or import
.mcap/.db3files and bag directories - Linked plots — shared scale and cursor; optional point tracking under the pointer; click a legend item to hide a curve
- Curve values — collapsible per-tab list of each curve’s latest X and Y, grouped by plot
- Time axes — message receipt time, start from zero, date-time labels, or raw stamps. Time zone in File → Preferences (local, UTC, or IANA). Optional plot-level Time window (last N seconds)
- Log scale — optional log scale on a plot’s X or Y axis. Values <= 0 are drawn below the axis. Time axes stay linear, and a log plot stays out of linked scale
- Light and dark — theme and plot-title size, weight, and color under File → Preferences. Changes apply to the open plots
-
Configs and export — File menu: open/save XML (
file://,home://,package://); import or add bags; export PNG, SVG, PDF, TXT, or CSV. Unsaved layout changes prompt on close. Older row×column files still load - Data statistics — right click on a plot to open the data statistics dialog, showing the mean, std, min, max, median, mode, range, count, RMS, and sum of the data
- Array curves — plot a whole array vs index (or vs another array field); the series is replaced on each message
-
Diagnostic messages — plot diagnostic messages from the
/diagnosticsor/diagnostics_aggtopic -
Topic metrics — plot the rate, bandwidth, and delay of a topic, as
ros2 topic hz,bw, anddelayshow them - Topic browser — browse live and bag topics, then drag’n’drop a field onto a plot
- Curve filters — ordered chain on a curve’s Y series: derivative, integral, moving average, low-pass, and others. Drag a filter onto a plot, or edit the chain in the curve dialog
- Markers — two vertical markers A and B per plot, with Δt and per-curve Δy and slope, to measure latency, rise time, or settling time
Also: run / pause / clear, circular and time-frame buffers, rad ↔ deg on an axis, grid on/off, drag-and-drop of curves between plot legends.
|
Light |
Dark |
Installation
ROS distribution
Coming soon. The package is not on the ROS build farm yet. After release:
sudo apt-get update
sudo apt-get install ros-jazzy-rqt-multiplot
sudo apt-get install ros-kilted-rqt-multiplot
sudo apt-get install ros-lyrical-rqt-multiplot
sudo apt-get install ros-rolling-rqt-multiplot
Building from source
Tested on ROS 2 Jazzy, Kilted, Lyrical, and Rolling. Put this repository in a colcon workspace src folder (clone or symlink), then:
cd ~/colcon_ws
rosdep install --from-paths src --ignore-src -y
colcon build --packages-select rqt_multiplot
source install/setup.bash
Usage
Standalone window (no rqt):
ros2 run rqt_multiplot multiplot
rqt plugin, either in its own rqt window or inside rqt (Plugins → Visualization → Multiplot):
ros2 run rqt_multiplot rqt_multiplot
rqt --force-discover
If the rqt plugin list or layout is broken:
rqt --clear-config
File truncated at 100 lines see the full file
CONTRIBUTING
Repository Summary
| Checkout URI | https://github.com/samuelba/rqt_multiplot_plugin.git |
| VCS Type | git |
| VCS Version | main |
| Last Updated | 2026-10-02 |
| Dev Status | MAINTAINED |
| Released | UNRELEASED |
| Contributing |
Help Wanted (-)
Good First Issues (-) Pull Requests to Review (-) |
Packages
| Name | Version |
|---|---|
| rqt_multiplot | 0.0.37 |
README
Rqt Multiplot Plugin
Plots numeric ROS 2 message fields in tiled 2D charts (Qwt). Nested splits and tabs give a layout that is not a strict grid. Subscribe to live topics or import a rosbag2, then inspect values with a linked cursor and a curve-values sidebar. Runs as its own window or as an rqt plugin.
Authors: Ralf Kaestner, Samuel Bachmann
Maintainer: Samuel Bachmann
License: GNU Lesser General Public License v3.0 (LGPL-3.0)
ROS2 distributions: Jazzy, Kilted, Lyrical, Rolling
Features
- Nested plot layout — split any plot left/right or top/bottom and nest splits (two on the left, one on the right). Drag splitter handles; reset the active tab to even sizes. Ratios are stored in the XML
- Tabs — multiple named layouts in one window; each tab has its own plots, colors, grid, and link/track settings
-
Live topics and rosbag2 — subscribe while running, or import
.mcap/.db3files and bag directories - Linked plots — shared scale and cursor; optional point tracking under the pointer; click a legend item to hide a curve
- Curve values — collapsible per-tab list of each curve’s latest X and Y, grouped by plot
- Time axes — message receipt time, start from zero, date-time labels, or raw stamps. Time zone in File → Preferences (local, UTC, or IANA). Optional plot-level Time window (last N seconds)
- Log scale — optional log scale on a plot’s X or Y axis. Values <= 0 are drawn below the axis. Time axes stay linear, and a log plot stays out of linked scale
- Light and dark — theme and plot-title size, weight, and color under File → Preferences. Changes apply to the open plots
-
Configs and export — File menu: open/save XML (
file://,home://,package://); import or add bags; export PNG, SVG, PDF, TXT, or CSV. Unsaved layout changes prompt on close. Older row×column files still load - Data statistics — right click on a plot to open the data statistics dialog, showing the mean, std, min, max, median, mode, range, count, RMS, and sum of the data
- Array curves — plot a whole array vs index (or vs another array field); the series is replaced on each message
-
Diagnostic messages — plot diagnostic messages from the
/diagnosticsor/diagnostics_aggtopic -
Topic metrics — plot the rate, bandwidth, and delay of a topic, as
ros2 topic hz,bw, anddelayshow them - Topic browser — browse live and bag topics, then drag’n’drop a field onto a plot
- Curve filters — ordered chain on a curve’s Y series: derivative, integral, moving average, low-pass, and others. Drag a filter onto a plot, or edit the chain in the curve dialog
- Markers — two vertical markers A and B per plot, with Δt and per-curve Δy and slope, to measure latency, rise time, or settling time
Also: run / pause / clear, circular and time-frame buffers, rad ↔ deg on an axis, grid on/off, drag-and-drop of curves between plot legends.
|
Light |
Dark |
Installation
ROS distribution
Coming soon. The package is not on the ROS build farm yet. After release:
sudo apt-get update
sudo apt-get install ros-jazzy-rqt-multiplot
sudo apt-get install ros-kilted-rqt-multiplot
sudo apt-get install ros-lyrical-rqt-multiplot
sudo apt-get install ros-rolling-rqt-multiplot
Building from source
Tested on ROS 2 Jazzy, Kilted, Lyrical, and Rolling. Put this repository in a colcon workspace src folder (clone or symlink), then:
cd ~/colcon_ws
rosdep install --from-paths src --ignore-src -y
colcon build --packages-select rqt_multiplot
source install/setup.bash
Usage
Standalone window (no rqt):
ros2 run rqt_multiplot multiplot
rqt plugin, either in its own rqt window or inside rqt (Plugins → Visualization → Multiplot):
ros2 run rqt_multiplot rqt_multiplot
rqt --force-discover
If the rqt plugin list or layout is broken:
rqt --clear-config
File truncated at 100 lines see the full file
CONTRIBUTING
Repository Summary
| Checkout URI | https://github.com/samuelba/rqt_multiplot_plugin.git |
| VCS Type | git |
| VCS Version | main |
| Last Updated | 2026-10-02 |
| Dev Status | MAINTAINED |
| Released | UNRELEASED |
| Contributing |
Help Wanted (-)
Good First Issues (-) Pull Requests to Review (-) |
Packages
| Name | Version |
|---|---|
| rqt_multiplot | 0.0.37 |
README
Rqt Multiplot Plugin
Plots numeric ROS 2 message fields in tiled 2D charts (Qwt). Nested splits and tabs give a layout that is not a strict grid. Subscribe to live topics or import a rosbag2, then inspect values with a linked cursor and a curve-values sidebar. Runs as its own window or as an rqt plugin.
Authors: Ralf Kaestner, Samuel Bachmann
Maintainer: Samuel Bachmann
License: GNU Lesser General Public License v3.0 (LGPL-3.0)
ROS2 distributions: Jazzy, Kilted, Lyrical, Rolling
Features
- Nested plot layout — split any plot left/right or top/bottom and nest splits (two on the left, one on the right). Drag splitter handles; reset the active tab to even sizes. Ratios are stored in the XML
- Tabs — multiple named layouts in one window; each tab has its own plots, colors, grid, and link/track settings
-
Live topics and rosbag2 — subscribe while running, or import
.mcap/.db3files and bag directories - Linked plots — shared scale and cursor; optional point tracking under the pointer; click a legend item to hide a curve
- Curve values — collapsible per-tab list of each curve’s latest X and Y, grouped by plot
- Time axes — message receipt time, start from zero, date-time labels, or raw stamps. Time zone in File → Preferences (local, UTC, or IANA). Optional plot-level Time window (last N seconds)
- Log scale — optional log scale on a plot’s X or Y axis. Values <= 0 are drawn below the axis. Time axes stay linear, and a log plot stays out of linked scale
- Light and dark — theme and plot-title size, weight, and color under File → Preferences. Changes apply to the open plots
-
Configs and export — File menu: open/save XML (
file://,home://,package://); import or add bags; export PNG, SVG, PDF, TXT, or CSV. Unsaved layout changes prompt on close. Older row×column files still load - Data statistics — right click on a plot to open the data statistics dialog, showing the mean, std, min, max, median, mode, range, count, RMS, and sum of the data
- Array curves — plot a whole array vs index (or vs another array field); the series is replaced on each message
-
Diagnostic messages — plot diagnostic messages from the
/diagnosticsor/diagnostics_aggtopic -
Topic metrics — plot the rate, bandwidth, and delay of a topic, as
ros2 topic hz,bw, anddelayshow them - Topic browser — browse live and bag topics, then drag’n’drop a field onto a plot
- Curve filters — ordered chain on a curve’s Y series: derivative, integral, moving average, low-pass, and others. Drag a filter onto a plot, or edit the chain in the curve dialog
- Markers — two vertical markers A and B per plot, with Δt and per-curve Δy and slope, to measure latency, rise time, or settling time
Also: run / pause / clear, circular and time-frame buffers, rad ↔ deg on an axis, grid on/off, drag-and-drop of curves between plot legends.
|
Light |
Dark |
Installation
ROS distribution
Coming soon. The package is not on the ROS build farm yet. After release:
sudo apt-get update
sudo apt-get install ros-jazzy-rqt-multiplot
sudo apt-get install ros-kilted-rqt-multiplot
sudo apt-get install ros-lyrical-rqt-multiplot
sudo apt-get install ros-rolling-rqt-multiplot
Building from source
Tested on ROS 2 Jazzy, Kilted, Lyrical, and Rolling. Put this repository in a colcon workspace src folder (clone or symlink), then:
cd ~/colcon_ws
rosdep install --from-paths src --ignore-src -y
colcon build --packages-select rqt_multiplot
source install/setup.bash
Usage
Standalone window (no rqt):
ros2 run rqt_multiplot multiplot
rqt plugin, either in its own rqt window or inside rqt (Plugins → Visualization → Multiplot):
ros2 run rqt_multiplot rqt_multiplot
rqt --force-discover
If the rqt plugin list or layout is broken:
rqt --clear-config
File truncated at 100 lines see the full file
CONTRIBUTING
Repository Summary
| Checkout URI | https://github.com/samuelba/rqt_multiplot_plugin.git |
| VCS Type | git |
| VCS Version | main |
| Last Updated | 2026-10-02 |
| Dev Status | MAINTAINED |
| Released | UNRELEASED |
| Contributing |
Help Wanted (-)
Good First Issues (-) Pull Requests to Review (-) |
Packages
| Name | Version |
|---|---|
| rqt_multiplot | 0.0.37 |
README
Rqt Multiplot Plugin
Plots numeric ROS 2 message fields in tiled 2D charts (Qwt). Nested splits and tabs give a layout that is not a strict grid. Subscribe to live topics or import a rosbag2, then inspect values with a linked cursor and a curve-values sidebar. Runs as its own window or as an rqt plugin.
Authors: Ralf Kaestner, Samuel Bachmann
Maintainer: Samuel Bachmann
License: GNU Lesser General Public License v3.0 (LGPL-3.0)
ROS2 distributions: Jazzy, Kilted, Lyrical, Rolling
Features
- Nested plot layout — split any plot left/right or top/bottom and nest splits (two on the left, one on the right). Drag splitter handles; reset the active tab to even sizes. Ratios are stored in the XML
- Tabs — multiple named layouts in one window; each tab has its own plots, colors, grid, and link/track settings
-
Live topics and rosbag2 — subscribe while running, or import
.mcap/.db3files and bag directories - Linked plots — shared scale and cursor; optional point tracking under the pointer; click a legend item to hide a curve
- Curve values — collapsible per-tab list of each curve’s latest X and Y, grouped by plot
- Time axes — message receipt time, start from zero, date-time labels, or raw stamps. Time zone in File → Preferences (local, UTC, or IANA). Optional plot-level Time window (last N seconds)
- Log scale — optional log scale on a plot’s X or Y axis. Values <= 0 are drawn below the axis. Time axes stay linear, and a log plot stays out of linked scale
- Light and dark — theme and plot-title size, weight, and color under File → Preferences. Changes apply to the open plots
-
Configs and export — File menu: open/save XML (
file://,home://,package://); import or add bags; export PNG, SVG, PDF, TXT, or CSV. Unsaved layout changes prompt on close. Older row×column files still load - Data statistics — right click on a plot to open the data statistics dialog, showing the mean, std, min, max, median, mode, range, count, RMS, and sum of the data
- Array curves — plot a whole array vs index (or vs another array field); the series is replaced on each message
-
Diagnostic messages — plot diagnostic messages from the
/diagnosticsor/diagnostics_aggtopic -
Topic metrics — plot the rate, bandwidth, and delay of a topic, as
ros2 topic hz,bw, anddelayshow them - Topic browser — browse live and bag topics, then drag’n’drop a field onto a plot
- Curve filters — ordered chain on a curve’s Y series: derivative, integral, moving average, low-pass, and others. Drag a filter onto a plot, or edit the chain in the curve dialog
- Markers — two vertical markers A and B per plot, with Δt and per-curve Δy and slope, to measure latency, rise time, or settling time
Also: run / pause / clear, circular and time-frame buffers, rad ↔ deg on an axis, grid on/off, drag-and-drop of curves between plot legends.
|
Light |
Dark |
Installation
ROS distribution
Coming soon. The package is not on the ROS build farm yet. After release:
sudo apt-get update
sudo apt-get install ros-jazzy-rqt-multiplot
sudo apt-get install ros-kilted-rqt-multiplot
sudo apt-get install ros-lyrical-rqt-multiplot
sudo apt-get install ros-rolling-rqt-multiplot
Building from source
Tested on ROS 2 Jazzy, Kilted, Lyrical, and Rolling. Put this repository in a colcon workspace src folder (clone or symlink), then:
cd ~/colcon_ws
rosdep install --from-paths src --ignore-src -y
colcon build --packages-select rqt_multiplot
source install/setup.bash
Usage
Standalone window (no rqt):
ros2 run rqt_multiplot multiplot
rqt plugin, either in its own rqt window or inside rqt (Plugins → Visualization → Multiplot):
ros2 run rqt_multiplot rqt_multiplot
rqt --force-discover
If the rqt plugin list or layout is broken:
rqt --clear-config
File truncated at 100 lines see the full file
CONTRIBUTING
Repository Summary
| Checkout URI | https://github.com/samuelba/rqt_multiplot_plugin.git |
| VCS Type | git |
| VCS Version | main |
| Last Updated | 2026-10-02 |
| Dev Status | MAINTAINED |
| Released | UNRELEASED |
| Contributing |
Help Wanted (-)
Good First Issues (-) Pull Requests to Review (-) |
Packages
| Name | Version |
|---|---|
| rqt_multiplot | 0.0.37 |
README
Rqt Multiplot Plugin
Plots numeric ROS 2 message fields in tiled 2D charts (Qwt). Nested splits and tabs give a layout that is not a strict grid. Subscribe to live topics or import a rosbag2, then inspect values with a linked cursor and a curve-values sidebar. Runs as its own window or as an rqt plugin.
Authors: Ralf Kaestner, Samuel Bachmann
Maintainer: Samuel Bachmann
License: GNU Lesser General Public License v3.0 (LGPL-3.0)
ROS2 distributions: Jazzy, Kilted, Lyrical, Rolling
Features
- Nested plot layout — split any plot left/right or top/bottom and nest splits (two on the left, one on the right). Drag splitter handles; reset the active tab to even sizes. Ratios are stored in the XML
- Tabs — multiple named layouts in one window; each tab has its own plots, colors, grid, and link/track settings
-
Live topics and rosbag2 — subscribe while running, or import
.mcap/.db3files and bag directories - Linked plots — shared scale and cursor; optional point tracking under the pointer; click a legend item to hide a curve
- Curve values — collapsible per-tab list of each curve’s latest X and Y, grouped by plot
- Time axes — message receipt time, start from zero, date-time labels, or raw stamps. Time zone in File → Preferences (local, UTC, or IANA). Optional plot-level Time window (last N seconds)
- Log scale — optional log scale on a plot’s X or Y axis. Values <= 0 are drawn below the axis. Time axes stay linear, and a log plot stays out of linked scale
- Light and dark — theme and plot-title size, weight, and color under File → Preferences. Changes apply to the open plots
-
Configs and export — File menu: open/save XML (
file://,home://,package://); import or add bags; export PNG, SVG, PDF, TXT, or CSV. Unsaved layout changes prompt on close. Older row×column files still load - Data statistics — right click on a plot to open the data statistics dialog, showing the mean, std, min, max, median, mode, range, count, RMS, and sum of the data
- Array curves — plot a whole array vs index (or vs another array field); the series is replaced on each message
-
Diagnostic messages — plot diagnostic messages from the
/diagnosticsor/diagnostics_aggtopic -
Topic metrics — plot the rate, bandwidth, and delay of a topic, as
ros2 topic hz,bw, anddelayshow them - Topic browser — browse live and bag topics, then drag’n’drop a field onto a plot
- Curve filters — ordered chain on a curve’s Y series: derivative, integral, moving average, low-pass, and others. Drag a filter onto a plot, or edit the chain in the curve dialog
- Markers — two vertical markers A and B per plot, with Δt and per-curve Δy and slope, to measure latency, rise time, or settling time
Also: run / pause / clear, circular and time-frame buffers, rad ↔ deg on an axis, grid on/off, drag-and-drop of curves between plot legends.
|
Light |
Dark |
Installation
ROS distribution
Coming soon. The package is not on the ROS build farm yet. After release:
sudo apt-get update
sudo apt-get install ros-jazzy-rqt-multiplot
sudo apt-get install ros-kilted-rqt-multiplot
sudo apt-get install ros-lyrical-rqt-multiplot
sudo apt-get install ros-rolling-rqt-multiplot
Building from source
Tested on ROS 2 Jazzy, Kilted, Lyrical, and Rolling. Put this repository in a colcon workspace src folder (clone or symlink), then:
cd ~/colcon_ws
rosdep install --from-paths src --ignore-src -y
colcon build --packages-select rqt_multiplot
source install/setup.bash
Usage
Standalone window (no rqt):
ros2 run rqt_multiplot multiplot
rqt plugin, either in its own rqt window or inside rqt (Plugins → Visualization → Multiplot):
ros2 run rqt_multiplot rqt_multiplot
rqt --force-discover
If the rqt plugin list or layout is broken:
rqt --clear-config
File truncated at 100 lines see the full file
CONTRIBUTING
Repository Summary
| Checkout URI | https://github.com/samuelba/rqt_multiplot_plugin.git |
| VCS Type | git |
| VCS Version | main |
| Last Updated | 2026-10-02 |
| Dev Status | MAINTAINED |
| Released | UNRELEASED |
| Contributing |
Help Wanted (-)
Good First Issues (-) Pull Requests to Review (-) |
Packages
| Name | Version |
|---|---|
| rqt_multiplot | 0.0.37 |
README
Rqt Multiplot Plugin
Plots numeric ROS 2 message fields in tiled 2D charts (Qwt). Nested splits and tabs give a layout that is not a strict grid. Subscribe to live topics or import a rosbag2, then inspect values with a linked cursor and a curve-values sidebar. Runs as its own window or as an rqt plugin.
Authors: Ralf Kaestner, Samuel Bachmann
Maintainer: Samuel Bachmann
License: GNU Lesser General Public License v3.0 (LGPL-3.0)
ROS2 distributions: Jazzy, Kilted, Lyrical, Rolling
Features
- Nested plot layout — split any plot left/right or top/bottom and nest splits (two on the left, one on the right). Drag splitter handles; reset the active tab to even sizes. Ratios are stored in the XML
- Tabs — multiple named layouts in one window; each tab has its own plots, colors, grid, and link/track settings
-
Live topics and rosbag2 — subscribe while running, or import
.mcap/.db3files and bag directories - Linked plots — shared scale and cursor; optional point tracking under the pointer; click a legend item to hide a curve
- Curve values — collapsible per-tab list of each curve’s latest X and Y, grouped by plot
- Time axes — message receipt time, start from zero, date-time labels, or raw stamps. Time zone in File → Preferences (local, UTC, or IANA). Optional plot-level Time window (last N seconds)
- Log scale — optional log scale on a plot’s X or Y axis. Values <= 0 are drawn below the axis. Time axes stay linear, and a log plot stays out of linked scale
- Light and dark — theme and plot-title size, weight, and color under File → Preferences. Changes apply to the open plots
-
Configs and export — File menu: open/save XML (
file://,home://,package://); import or add bags; export PNG, SVG, PDF, TXT, or CSV. Unsaved layout changes prompt on close. Older row×column files still load - Data statistics — right click on a plot to open the data statistics dialog, showing the mean, std, min, max, median, mode, range, count, RMS, and sum of the data
- Array curves — plot a whole array vs index (or vs another array field); the series is replaced on each message
-
Diagnostic messages — plot diagnostic messages from the
/diagnosticsor/diagnostics_aggtopic -
Topic metrics — plot the rate, bandwidth, and delay of a topic, as
ros2 topic hz,bw, anddelayshow them - Topic browser — browse live and bag topics, then drag’n’drop a field onto a plot
- Curve filters — ordered chain on a curve’s Y series: derivative, integral, moving average, low-pass, and others. Drag a filter onto a plot, or edit the chain in the curve dialog
- Markers — two vertical markers A and B per plot, with Δt and per-curve Δy and slope, to measure latency, rise time, or settling time
Also: run / pause / clear, circular and time-frame buffers, rad ↔ deg on an axis, grid on/off, drag-and-drop of curves between plot legends.
|
Light |
Dark |
Installation
ROS distribution
Coming soon. The package is not on the ROS build farm yet. After release:
sudo apt-get update
sudo apt-get install ros-jazzy-rqt-multiplot
sudo apt-get install ros-kilted-rqt-multiplot
sudo apt-get install ros-lyrical-rqt-multiplot
sudo apt-get install ros-rolling-rqt-multiplot
Building from source
Tested on ROS 2 Jazzy, Kilted, Lyrical, and Rolling. Put this repository in a colcon workspace src folder (clone or symlink), then:
cd ~/colcon_ws
rosdep install --from-paths src --ignore-src -y
colcon build --packages-select rqt_multiplot
source install/setup.bash
Usage
Standalone window (no rqt):
ros2 run rqt_multiplot multiplot
rqt plugin, either in its own rqt window or inside rqt (Plugins → Visualization → Multiplot):
ros2 run rqt_multiplot rqt_multiplot
rqt --force-discover
If the rqt plugin list or layout is broken:
rqt --clear-config
File truncated at 100 lines see the full file